Required Software and Installation
The course uses the R programming language (and several add-ons, so-called “packages”, including ggplot2).
In addition, this course heavily relies on the RStudio software environment to write and execute R scripts and to manage projects. The RStudio IDE (Integrated Development Environment) provides a number of important functions that make using R and ggplot2 easier which we will learn as the course progresses.
Finally, we will make use of a number of R packages from the so-called tidyverse. The tidyverse is a collection of packages that make reading, processing and transforming, modeling, and–most importantly for this course–data visualization much easier and straightforward.
Installation Instructions
Important: I assume that you will have installed or updated the following software and R packages, as we won’t have time during the workshop to do so.
Install R
Download the latest pre-compiled version of R from https://cran.r-project.org/ (both Windows/Mac/Linux binaries are available). The latest R version, as of this writing, is R 3.4.3. If you have R already installed, make sure that it’s version 3.3 or higher. If it’s lower than 3.3 you should update your R version. This can be a bit tricky, but the
installrpackage helps with that. Instructions for updating R with the installr package can be found here: https://github.com/talgalili/installr/.To install R, execute the downloaded binary and follow the instructions on the screen.
Install RStudio
- Download the “Free” version of RStudio at https://www.rstudio.com/products/rstudio/download/. Binaries are available for all major operating systems. If you have RStudio installed, make sure that you’re using RStudio v > 1.0 (to check, open RStudio => Help => About RStudio. In this drop down menu, you’ll also find the option to update directly.)
- Execute the binary file and install RStudio following the instructions on the screen.
Install required packages
- Open RStudio and type (or copy and paste) the following code into the R console on the lower right corner to install the required packages for the course.
install.packages("tidyverse") # data management and visualization packages, incl. ggplot2
install.packages("readxl") # for reading Excel files
install.packages("haven") # for reading SPSS and Stata files
install.packages("gapminder") # example data sets

# For maps
library(maptools)
library(sp)
library(countrycode)

# for shiny (second day)
install.packages("shiny")
Make sure your installation works
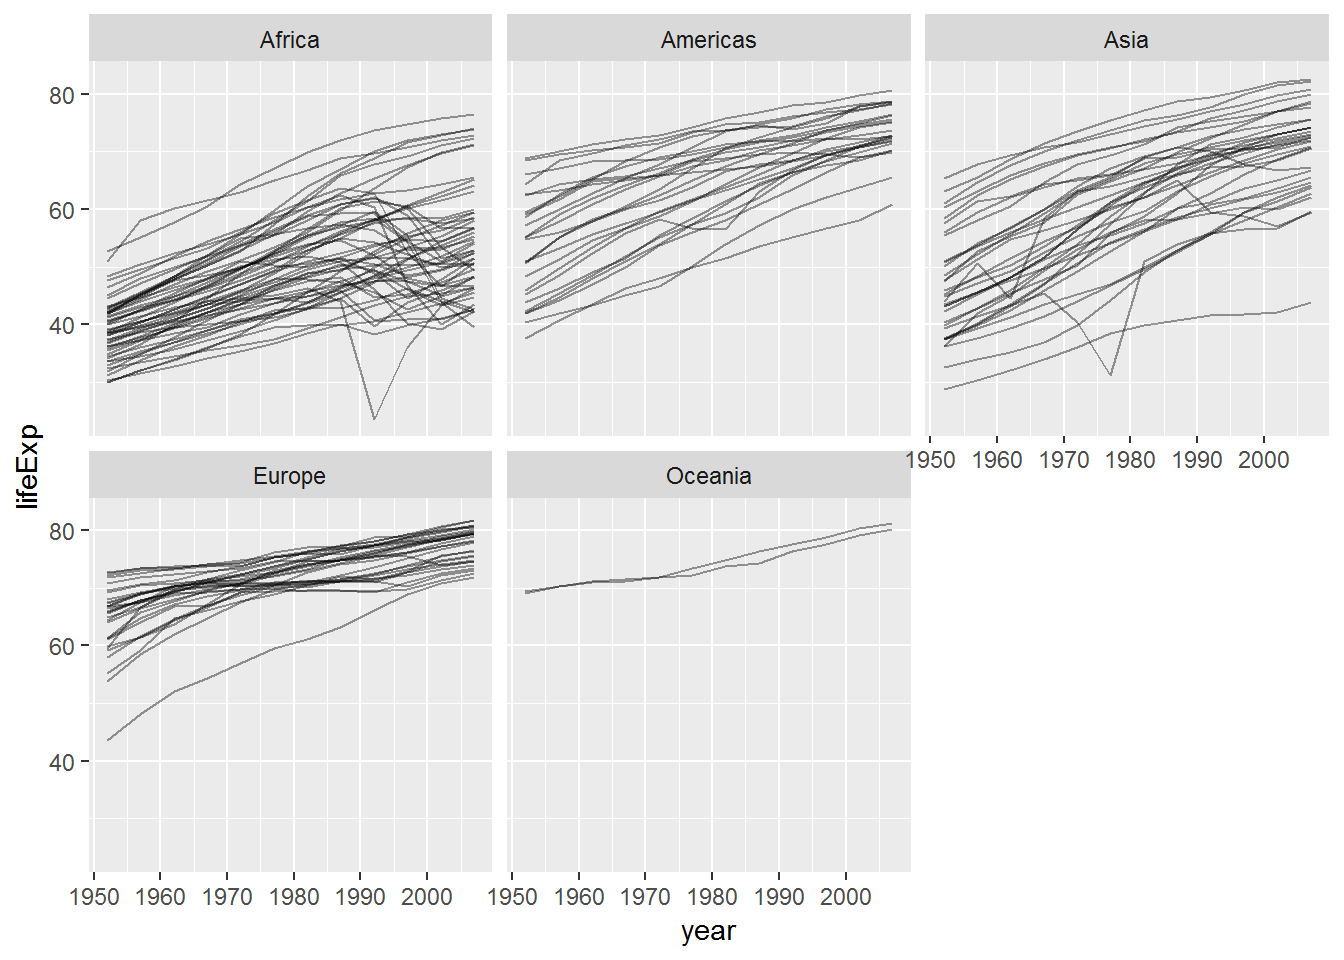
After following the above instructions, open RStudio (if it isn’t already open) and copy and paste the following into the R console and hit Enter.
library(tidyverse)
library(gapminder)

test_plot <- ggplot(gapminder, aes(x = year,
                                   y = lifeExp,
                                   group = country)) +
  geom_line(alpha = 0.4) +
  facet_wrap(~continent)

print(test_plot)
This should produce the following plot: