Chapter 8: Public Goods
Figure 8.1: Public Goods, Power-Sharing, and Aid: Individual Patterns
# Libraries
library(tidyverse)
library(cowplot)
library(lfe)
library(tikzDevice)

# Data
load("./data/diss_df.rda")


# generate cabinetINC label variable for plotting
diss_df$cabinetINClabel <- ifelse(diss_df$cabinetINC == 1, "Power-Sharing",
                                    "No Power-Sharing")

plot_ps_spending <- ggplot(diss_df, aes(x = cabinetINClabel, y = v2dlencmps_t1)) +
  geom_jitter(size = 1.7, alpha = 0.5) +
  geom_boxplot(aes(fill = cabinetINClabel), alpha = 0.6) +
  scale_fill_brewer(palette = "Blues") +
  stat_summary(aes(group = 1), fun.y = mean, geom = "point", shape = 23,
               size = 4, fill = "#d7191c", color = "#d7191c") +
  theme_bw() +
  theme(legend.position = "none", axis.text = element_text(size = 11)) +
  labs(x = "", y = "Particularistic vs. Public Spending")


plot_allaid_spending <- ggplot(diss_df,
                               aes(x = log(aiddata_AidGDP),
                                   y = v2dlencmps_t1)) +
  geom_point(alpha = 0.5, size = 1.7) +
  geom_smooth(method = "lm") +
  theme_bw() +
  labs(x = "All Aid / GDP (log)",
       y = "Particularistic. vs. Public Spending")


# Output for Manuscript
# options( tikzDocumentDeclaration = "\\documentclass[11pt]{article}" )
# tikz("../figures/aid_ps_individ_spending.tex", height = 3.5)
# gridExtra::grid.arrange(plot_ps_spending, plot_allaid_spending, nrow = 1)
# dev.off()

# Output for Rep. Archive
gridExtra::grid.arrange(plot_ps_spending, plot_allaid_spending, nrow = 1)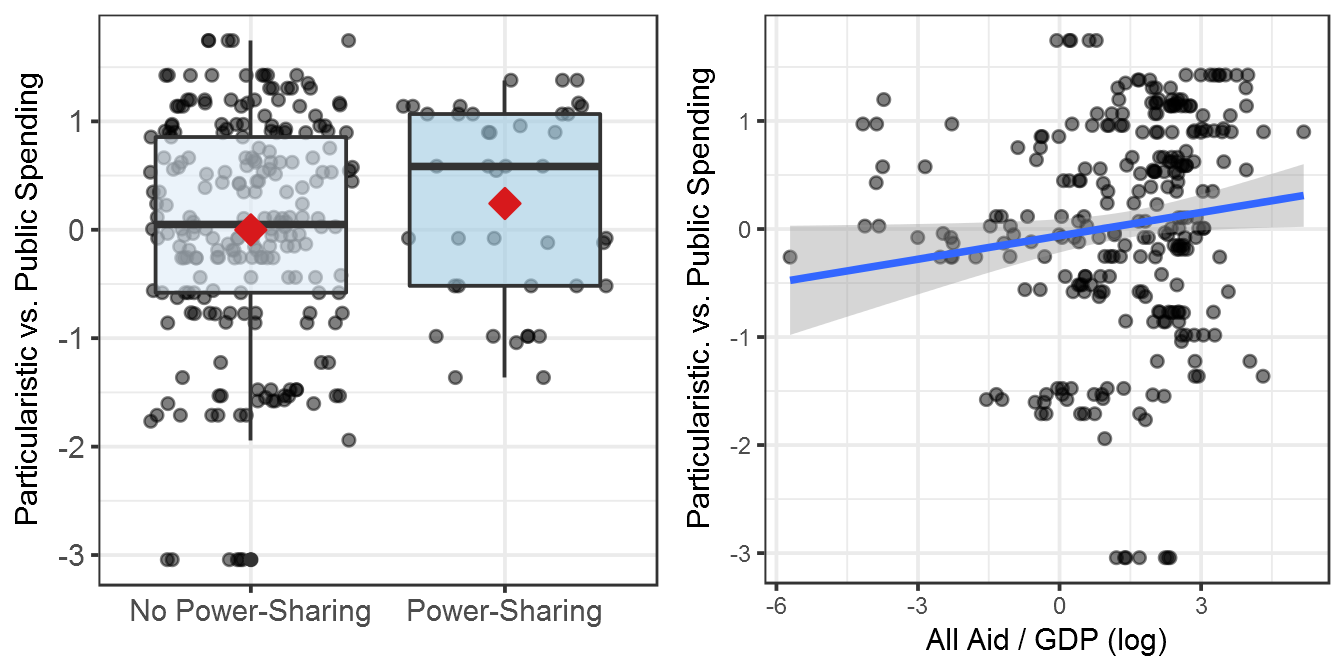
Figure 8.2: Foreign Aid and Particularistic vs. Public Goods Spending in Country-Years With and Without Power-Sharing Governments
# Libraries
library(tidyverse)
library(cowplot)
library(lfe)
library(tikzDevice)

# Data
load("./data/diss_df.rda")


# generate cabinetINC label variable for plotting
diss_df$cabinetINClabel <- ifelse(diss_df$cabinetINC == 1, "Power-Sharing",
                                    "No Power-Sharing")
# generate plot
plot_aidps_spending <- ggplot(diss_df,
                               aes(x = log(aiddata_AidGDP),
                                   y = v2dlencmps_t1)) +
  geom_point(alpha = 0.5) +
  geom_smooth(method = "lm") +
  facet_wrap(~ cabinetINClabel) +
  theme_bw() +
  labs(x = "All Aid / GDP (log)",
       y = "Particularistic. vs. Public Spending")

# Output for Manuscript
# options( tikzDocumentDeclaration = "\\documentclass[11pt]{article}" )
# tikz("../figures/aidps_spending_plot.tex", height = 3.5)
# print(plot_aidps_spending)
# dev.off()

# Output for Rep. Archive
print(plot_aidps_spending)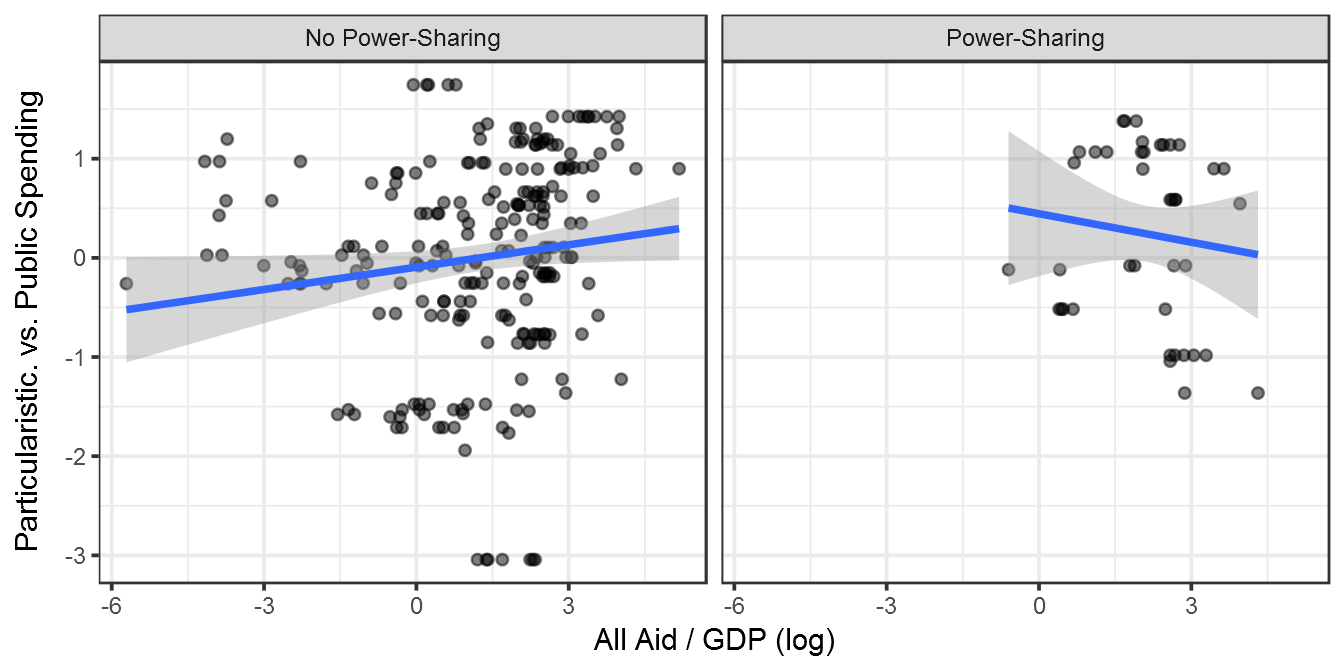
Figure 8.3: Temporal Dynamics of the Interactive Effect between Power-Sharing and Foreign Aid on Public Goods Provision
# Libraries
library(tidyverse)
library(cowplot)
library(lfe)
library(tikzDevice)


# Data
load("./data/diss_df.rda")

diss_df <- diss_df %>%
  dplyr::select(-matches("logit"))

# Prepare data frame for multiple plots
spending_vars <- list(
  v2dlencmps_t1 = diss_df,
  v2dlencmps_t2 = diss_df,
  v2dlencmps_t3 = diss_df,
  v2dlencmps_t4 = diss_df,
  v2dlencmps_t5 = diss_df,
  v2x_corr_t1 = diss_df,
  v2x_corr_t2 = diss_df,
  v2x_corr_t3 = diss_df,
  v2x_corr_t4 = diss_df,
  v2x_corr_t5 = diss_df
)

# create data frame with list column
spending_vars <- enframe(spending_vars)

# define function that will be applied to every data frame in the list column
main_model <- function(lead_type, data) {
  data <- as.data.frame(data)
  data$lead_var <- data[, grep(lead_type, names(data), value =T)]
  model <- lfe::felm(lead_var ~
                       cabinetCOUNT *
                       aiddata_AidGDP_ln +
                       log(GDP_per_capita) +
                       ln_pop +
                       conf_intens +
                       nonstate +
                       WBnatres +
                       fh | 0 | 0 | GWNo,
                     data=data)
  return(model)

}


# fit models & post-process data for plotting
model_all <- spending_vars %>%
  dplyr::mutate(model = map2(name, value, ~ main_model(.x, .y)))

model_out <- model_all %>%
  mutate(coef = map(model, broom::tidy)) %>%
  unnest(coef) %>%
  # keep only interaction term coefs
  filter(term == "cabinetCOUNT:aiddata_AidGDP_ln") %>%
  mutate(dem_score = ifelse(grepl("v2dlencmps", name), "Public vs. Particularistic Spending", "Political Corruption")) %>%
  dplyr::select(dem_score, name, estimate, std.error) %>%
  group_by(dem_score) %>%
  mutate(name = 1:5)


temp_dyn_pubgoods <- model_out
save(temp_dyn_pubgoods, file = "./data/temp_dyn_pubgoods.rda")


temp_dynamics_plot <- ggplot(model_out,
                             aes(x = name,
                                 y = estimate,
                                 group = dem_score, color = dem_score)) +
  geom_point( aes(group = dem_score), size = 1.7,
              position = position_dodge(width = .5)) +

  geom_errorbar(aes(ymin = estimate - 1.67 * std.error,
                    ymax = estimate + 1.67 * std.error,
                    linetype = dem_score),
                width = 0,
                position = position_dodge(width = .5)) +

  geom_hline(yintercept = 0, linetype = 2) +
  scale_color_manual("", values = c("#4575b4", "#e41a1c")) +
  scale_linetype_manual("", values = c(1, 5)) +
  theme_bw()+
  labs(x = "Year after t0", y = "Estimate of Interaction Coefficient \n between Power-Sharing (cabinet)\n and Aid/GDP (log)") +
   theme(legend.position = "bottom") +
  theme(legend.key.size=unit(3,"lines")) # +
  # annotate("rect", xmin=1.5, xmax=2.5, ymin=-Inf, ymax=Inf, alpha=.1, fill="blue")

# Output for manuscript
# options(tikzDocumentDeclaration = "\\documentclass[11pt]{article}" )
# tikz("../figures/temp_dynamics_plot_spending.tex", height = 3.5)
# print(temp_dynamics_plot)
# dev.off()

# Output for replication archive
print(temp_dynamics_plot)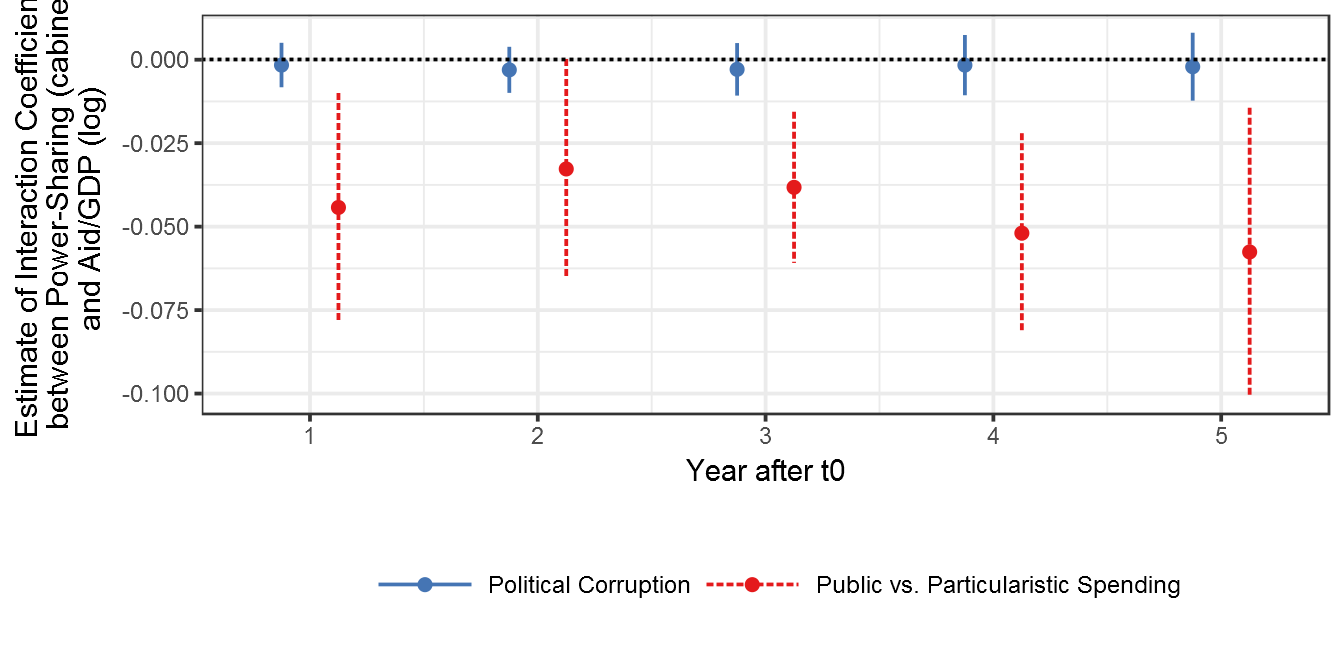
Figure 8.4: Marginal Effects of Power-Sharing and Foreign Aid on Particularistic vs. Private Spending
# Libraries
library(tidyverse)
library(rms)
library(gridExtra)
library(tikzDevice)

# Load data
load("data/diss_df.rda")

# Estimate Models


# binary PS
model_aidps_spending_cabINC <- ols(v2dlencmps_t1 ~
                                     cabinetINC *
                                     aiddata_AidGDP_ln +
                                     ln_gdp_pc +
                                     ln_pop +
                                     conf_intens +
                                     nonstate +
                                     WBnatres +
                                     fh,
                                   data=diss_df, x=T, y=T)
model_aidps_spending_cabINC <- rms::robcov(model_aidps_spending_cabINC, diss_df$GWNo)


model_aidps_spending <- ols(v2dlencmps_t1 ~
                              cabinetCOUNT *
                              aiddata_AidGDP_ln +
                              ln_gdp_pc +
                              ln_pop +
                              conf_intens +
                              nonstate +
                              WBnatres +
                              fh,
                            data=diss_df, x=T, y=T)
model_aidps_spending <- rms::robcov(model_aidps_spending, diss_df$GWNo)


# Generate ME plots

source("functions/interaction_plots.R")

#
# # Output for manuscript
# options(tikzDocumentDeclaration = "\\documentclass[11pt]{article}" )
# tikz("../figures/interaction_spending.tex", height = 3.5)
#
#
# par(mfrow=c(1,3),
#     mar = c(5, 7, 4, 0.5),
#     cex.lab = 1.3,
#     cex.axis = 1.3,
#     mgp = c(3.5, 1, 0))
#
# interaction_plot_continuous(model_aidps_spending,
#                             "cabinetCOUNT",
#                             "aiddata_AidGDP_ln",
#                             "cabinetCOUNT * aiddata_AidGDP_ln",
#                             title = "",
#                             ylab = "Marginal effect of Power-Sharing (cabinet) \n on Public vs. Particularistic Spending",
#                             add_median_effect = T,
#                             xlab = "a) Aid / GDP (Log)\n",
#                             conf = .90)
# interaction_plot_continuous(model_aidps_spending,
#                             "aiddata_AidGDP_ln",
#                             "cabinetCOUNT",
#                             "cabinetCOUNT * aiddata_AidGDP_ln",
#                             title = "",
#                             add_median_effect = T,
#                             ylab = "Marginal effect of Aid\n on Public vs. Particularistic Spending",
#                             xlab = "b) Power-Sharing \n(Number of rebel seats)",
#                             conf = .90)
# interaction_plot_binary(model_aidps_spending_cabINC,
#                         "aiddata_AidGDP_ln",
#                         "cabinetINC",
#                         "cabinetINC * aiddata_AidGDP_ln",
#                         title = "",
#                         ylab = "Marginal effect of Aid\n on Public vs. Particularistic Spending",
#                         xlab = "c) Power-Sharing \n(1 = Yes, 0 = No)",
#                         conf = .90)
#
# dev.off()

# Output for Replication Archive


par(mfrow=c(1,3),
    mar = c(5, 7, 4, 0.5),
    cex.lab = 1.3,
    cex.axis = 1.3,
    mgp = c(3.5, 1, 0))


interaction_plot_continuous(model_aidps_spending,
                            "cabinetCOUNT",
                            "aiddata_AidGDP_ln",
                            "cabinetCOUNT * aiddata_AidGDP_ln",
                            title = "",
                            ylab = "Marginal effect of Power-Sharing (cabinet) \n on Public vs. Particularistic Spending",
                            add_median_effect = T,
                            xlab = "a) Aid / GDP (Log)\n",
                            conf = .90)
interaction_plot_continuous(model_aidps_spending,
                            "aiddata_AidGDP_ln",
                            "cabinetCOUNT",
                            "cabinetCOUNT * aiddata_AidGDP_ln",
                            title = "",
                            add_median_effect = T,
                            ylab = "Marginal effect of Aid\n on Public vs. Particularistic Spending",
                            xlab = "b) Power-Sharing \n(Number of rebel seats)",
                            conf = .90)
interaction_plot_binary(model_aidps_spending_cabINC,
                        "aiddata_AidGDP_ln",
                        "cabinetINC",
                        "cabinetINC * aiddata_AidGDP_ln",
                        title = "",
                        ylab = "Marginal effect of Aid\n on Public vs. Particularistic Spending",
                        xlab = "c) Power-Sharing \n(1 = Yes, 0 = No)",
                        conf = .90)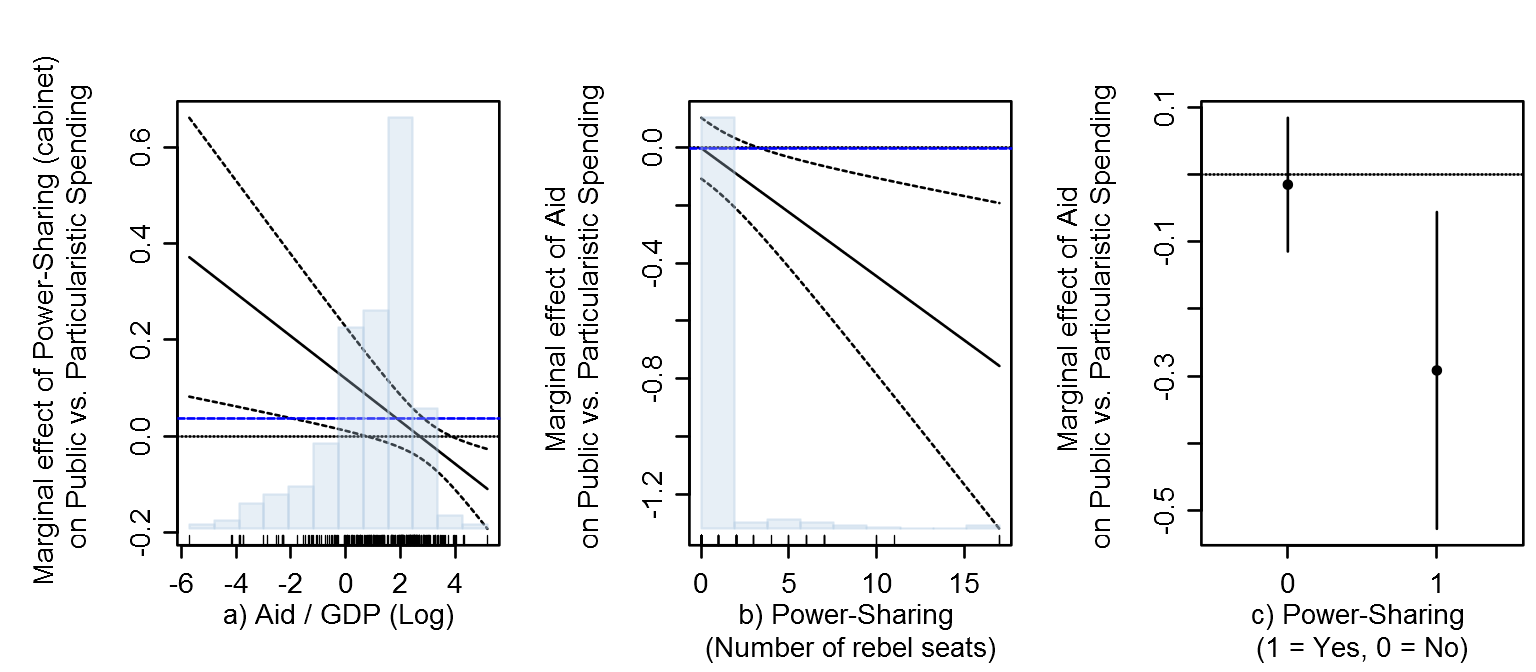
Figure 8.5: Probing Mechanisms: Variation in Types of Power-Sharing and Aid
# Libraries
library(tidyverse)
library(cowplot)
library(lfe)
library(tikzDevice)


# Data
load("./data/diss_df.rda")

diss_df <- diss_df %>%
  dplyr::select(-matches("logit")) %>%
  mutate(dga_gdp_ln = log(dga_gdp_zero +1 ),
         pga_gdp_ln = log(program_aid_gdp_zero + 1),
         bga_gdp_ln = log(commodity_aid_gdp_zero + 1))

# Prepare data frame for multiple plots
spending_vars <- list(
  cabinetCOUNT = diss_df,
  seniorCOUNT = diss_df,
  nonseniorCOUNT = diss_df,
  dga_gdp_ln = diss_df,
  pga_gdp_ln = diss_df,
  bga_gdp_ln = diss_df
)

# create data frame with list column
spending_vars <- enframe(spending_vars)


# define function that will be applied to every data frame in the list column
main_model <- function(ind_var, data) {
  data <- as.data.frame(data)
  data$ind_var <- data[, ind_var]

  if(grepl("COUNT", ind_var)) {
    model <- lfe::felm(v2dlencmps_t1 ~
                       ind_var *
                       aiddata_AidGDP_ln +
                       log(GDP_per_capita) +
                       ln_pop +
                       conf_intens +
                       nonstate +
                       WBnatres +
                       fh | 0 | 0 | GWNo,
                     data=data)
    return(model)

  } else {
    model <- lfe::felm(v2dlencmps_t1 ~
                       cabinetCOUNT *
                       ind_var +
                       log(GDP_per_capita) +
                       ln_pop +
                       conf_intens +
                       nonstate +
                       WBnatres +
                       fh | 0 | 0 | GWNo,
                     data=data)
  return(model)
  }


}


# fit models & post-process data for plotting
model_all <- spending_vars %>%
  dplyr::mutate(model = map2(name, value, ~ main_model(.x, .y)))

model_out <- model_all %>%
  mutate(coef = map(model, broom::tidy)) %>%
  unnest(coef) %>%
  # keep only interaction term coefs
  filter(grepl(":", term)) %>%
  dplyr::select(name, estimate, std.error) %>%
  mutate(name = forcats::fct_relevel(name,
                                     c("cabinetCOUNT",
                                       "seniorCOUNT",
                                       "nonseniorCOUNT",
                                       "dga_gdp_ln",
                                       "pga_gdp_ln",
                                       "bga_gdp_ln")))

model_out_pubgoods <- model_out
save(model_out_pubgoods, file= "./data/mechanism_models_pubgoods.rda")


mechanisms_spending_plot <- ggplot(model_out,
       aes(x = name,
           y = estimate)) +
  geom_point( size = 1.7,
       position = position_dodge(width = .5)) +
  geom_errorbar(aes(ymin = estimate - 1.67 * std.error,
                    ymax = estimate + 1.67 * std.error),
                width = 0,
       position = position_dodge(width = .5)) +

  geom_hline(yintercept = 0, linetype = 2) +
  theme_bw()+
  scale_x_discrete(labels = c("Cabinet PS (Baseline)",
                                      "Senior PS",
                                      "Nonsenior PS",
                                      "DGA",
                                      "Program Aid",
                                      "Budget Aid")) +
  labs(x = "", y = "Estimate of Interaction Coefficient \n between Different Types of \n Power-Sharing (cabinet) and Aid")


# Output for manuscript
# options(tikzDocumentDeclaration = "\\documentclass[11pt]{article}" )
# tikz("../figures/mechanisms_spending_plot.tex", height = 2.75)
# print(mechanisms_spending_plot)
# dev.off()

# Output for replication archive
print(mechanisms_spending_plot)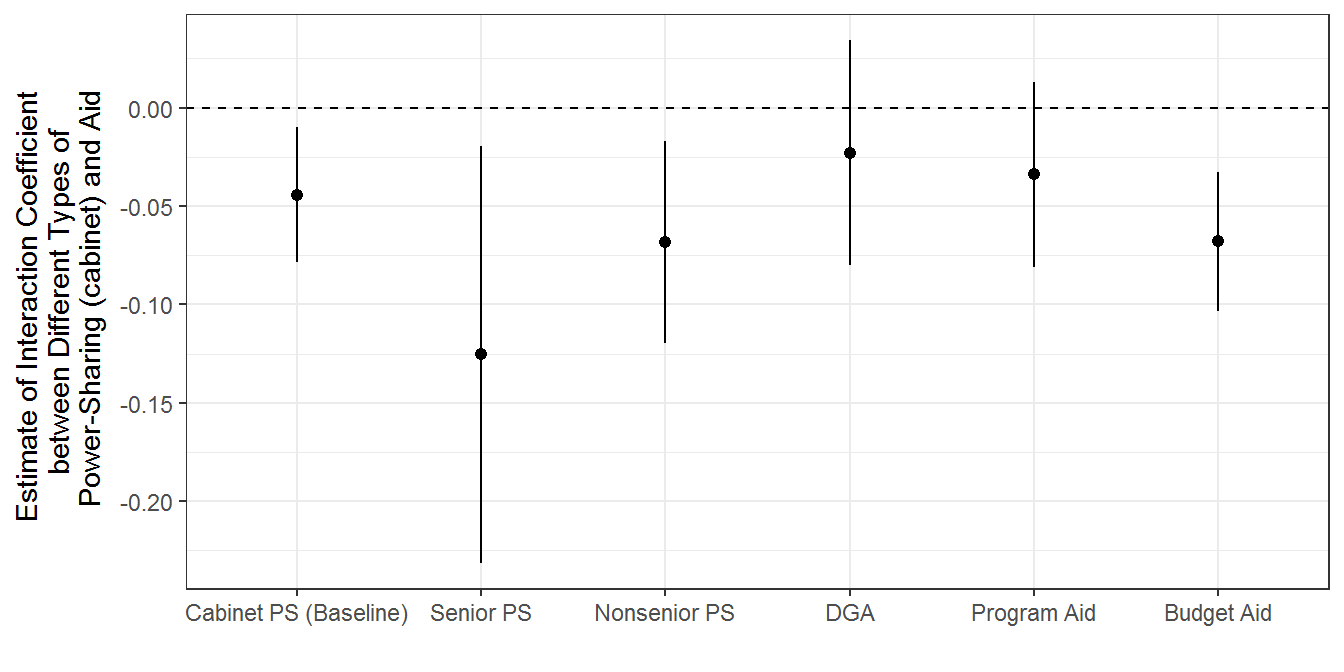
Figure 8.6: Model Predictions for the Effect of Power-Sharing and Budget Aid on Post-Conflict Public Goods Provision
# Libraries
library(tidyverse)
library(rms)
library(gridExtra)
library(tikzDevice)

# Load data
load("data/diss_df.rda")

diss_df <- diss_df %>%
  dplyr::select(-matches("logit")) %>%
  mutate(dga_gdp_ln = log(dga_gdp_zero +1 ),
         pga_gdp_ln = log(program_aid_gdp_zero + 1),
         bga_gdp_ln = log(commodity_aid_gdp_zero + 1))

# to predict substantive effects from this model, we need to define data
# distribution
diss_df$conflictID <- NULL
datadist_diss_df <- datadist(diss_df); options(datadist='datadist_diss_df')

# replicate Model from above with spending + cabCOUNT

model_aidps_spending <- ols(v2dlencmps_t1 ~
                              cabinetCOUNT *
                             bga_gdp_ln +
                              aiddata_AidGDP_ln +
                              ln_gdp_pc +
                              ln_pop +
                              conf_intens +
                              nonstate +
                              WBnatres +
                              fh,
                            data=diss_df, x=T, y=T)
model_aidps_spending <- rms::robcov(model_aidps_spending, diss_df$GWNo)

# Start predictions for aid
prediction_democ_aid <- Predict(model_aidps_spending,
                           cabinetCOUNT = c(0, 10), # no / much power-sharing
                           bga_gdp_ln = seq(-8, 4.9, 0.1),# range of aid
                           conf.int = 0.9)

subs_effects_spending_aid <- ggplot(data.frame(prediction_democ_aid),
                                    aes(x = exp(bga_gdp_ln),
                                        y = yhat,
                                        group = as.factor(cabinetCOUNT))) +
  geom_line( color = "black", size = 1) +
  geom_ribbon(aes(ymax = upper,
                  ymin = lower,
                  fill = as.factor(cabinetCOUNT)),
              alpha = 0.7) +
  scale_fill_manual(values = c("#b3cde3", "#e41a1c"),
                    name = "Number of Rebels \nin the Power-Sharing Coalition:") +
  theme_bw() +
  theme(text = element_text(size=8)) +
  labs(x = "Budget Aid / GDP",
       y = "Predicted Public vs. \nParticularistic Spending Scores") +
  theme(legend.position = "bottom")

# Predictions power-sharing
prediction_democ_ps <- Predict(model_aidps_spending,
                              cabinetCOUNT = seq(0, 10, 1),
                              bga_gdp_ln = c(0, 3.4),
                              conf.int = 0.9)

prediction_democ_ps$bga_gdp_ln <- round(exp(prediction_democ_ps$bga_gdp_ln))


subs_effects_spending_ps <- ggplot(data.frame(prediction_democ_ps),
                                           aes(x = cabinetCOUNT,
                                               y = yhat,
                                               group = as.factor(exp(bga_gdp_ln)))) +
  geom_line( color = "black", size = 1) +
  geom_ribbon(aes(ymax = upper,
                  ymin = lower,
                  fill = as.factor(bga_gdp_ln)),
              alpha = 0.7) +
  scale_fill_manual(values = c("#b3cde3", "#e41a1c"),
                    name = "Budget Aid in per cent of GDP:") +
  theme_bw() +
  scale_x_continuous(breaks = seq(0, 10, 2)) +
  theme(text = element_text(size=8)) +
  labs(x = "Power-Sharing (No. of rebel seats in government)",
       y = "Predicted Public vs. \nParticularistic Spending Scores") +
  theme(legend.position = "bottom")

# output prediction plots


# output plot for predicted VDEM election quality variables


# options( tikzDocumentDeclaration = "\\documentclass[11pt]{article}" )
# tikz("../figures/budget_aidps_spending.tex", height = 4.5, width = 6.5)
# grid.arrange(subs_effects_spending_ps,
#              subs_effects_spending_aid,
#              nrow = 1)
# dev.off()

grid.arrange(subs_effects_spending_ps,
             subs_effects_spending_aid,
             nrow = 1)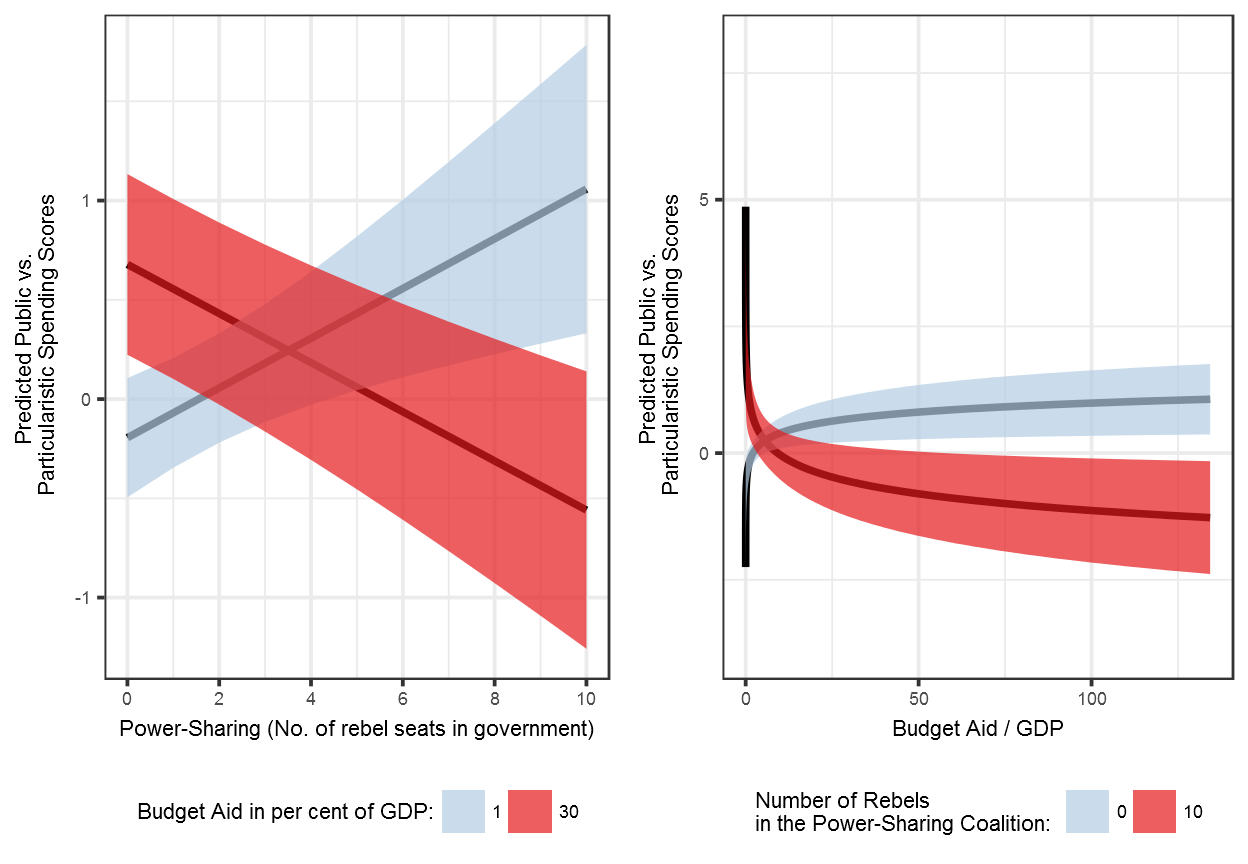
Table 8.1: Power-Sharing, Foreign Aid, and Post-Conflict Provision of Public Goods: Individual Effects
# Libraries
library(texreg)
source("functions/extract_ols_custom.R")
library(rms)


# load Data
load("./data/diss_df.rda")


# Power-Sharing Models
model_ps_spending_cabcount <- ols(v2dlencmps_t1 ~
                                     cabinetCOUNT +
                                     aiddata_AidGDP_ln +
                                     ln_gdp_pc +
                                     ln_pop +
                                     conf_intens +
                                     nonstate +
                                     WBnatres +
                                     fh,
                                   data=diss_df, x=T, y=T)
model_ps_spending_cabcount <- rms::robcov(model_ps_spending_cabcount, diss_df$GWNo)


model_ps_spending_seniorcount <- ols(v2dlencmps_t1 ~
                              seniorCOUNT  +
                              aiddata_AidGDP_ln +
                              ln_gdp_pc +
                              ln_pop +
                              conf_intens +
                              nonstate +
                              WBnatres +
                              fh,
                            data=diss_df, x=T, y=T)
model_ps_spending_seniorcount <- rms::robcov(model_ps_spending_seniorcount, diss_df$GWNo)


model_ps_spending_nonseniorcount <- ols(v2dlencmps_t1 ~
                              nonseniorCOUNT +
                              aiddata_AidGDP_ln +
                              ln_gdp_pc +
                              ln_pop +
                              conf_intens +
                              nonstate +
                              WBnatres +
                              fh,
                            data=diss_df, x=T, y=T)
model_ps_spending_nonseniorcount <- rms::robcov(model_ps_spending_nonseniorcount, diss_df$GWNo)

# Aid Models

model_dga_spending <- ols(v2dlencmps_t1 ~
                              cabinetCOUNT +
                            log(dga_gdp_zero + 1) +
                              aiddata_AidGDP_ln +
                              ln_gdp_pc +
                              ln_pop +
                              conf_intens +
                              nonstate +
                              WBnatres +
                              fh,
                            data=diss_df, x=T, y=T)
model_dga_spending <- rms::robcov(model_dga_spending, diss_df$GWNo)

model_pga_spending <- ols(v2dlencmps_t1 ~
                              cabinetCOUNT +
                            log(program_aid_gdp_zero + 1) +
                              aiddata_AidGDP_ln +
                              ln_gdp_pc +
                              ln_pop +
                              conf_intens +
                              nonstate +
                              WBnatres +
                              fh,
                            data=diss_df, x=T, y=T)
model_pga_spending <- rms::robcov(model_pga_spending, diss_df$GWNo)

model_bga_spending <- ols(v2dlencmps_t1 ~
                              cabinetCOUNT +
                            log(commodity_aid_gdp_zero + 1) +
                              aiddata_AidGDP_ln +
                              ln_gdp_pc +
                              ln_pop +
                              conf_intens +
                              nonstate +
                              WBnatres +
                              fh,
                            data=diss_df, x=T, y=T)
model_bga_spending <- rms::robcov(model_bga_spending, diss_df$GWNo)


model_list <- list(model_ps_spending_cabcount,
                   model_ps_spending_seniorcount,
                   model_ps_spending_nonseniorcount,
                   model_dga_spending,
                   model_pga_spending,
                   model_bga_spending)

coef_name_map <- list(
                      cabinetINC = "Power-Sharing (binary)",
                      "cabinetINC * aiddata_AidGDP_ln" = "Power-Sharing (binary) * Aid",
                      cabinetCOUNT = "Power-Sharing (cabinet)",
                                            seniorCOUNT = "Power-Sharing (senior)",
                      nonseniorCOUNT = "Power-Sharing (nonsenior)",

                      "cabinetCOUNT * aiddata_AidGDP_ln" = "Power-Sharing (cabinet) * Aid",
                      "cabinetCOUNT:aiddata_AidGDP_ln" = "PS (cabinet) * Aid",
                      ps_share = "PS (cabinet share)",
                      "ps_share * aiddata_AidGDP_ln" = "PS (cabinet share) * Aid",
                      dga_gdp_zero = "DGA/GDP (log)",
                      program_aid_gdp_zero = "Program Aid/GDP (log)",
                      commodity_aid_gdp_zero = "Budget Aid/GDP (log)",
                      aiddata_AidGDP_ln = "Aid / GDP (log)",

                      ln_gdp_pc = "GDP p/c (log)",
                      ln_pop = "Population (log)",
                      conf_intens = "Conflict Intensity",
                      nonstate = "Non-State Violence",
                      WBnatres = "Nat. Res. Rents",
                      polity2 = "Polity",
                      fh = "Regime Type (FH)",
                      Ethnic = "Ethnic Frac.",
                      DS_ordinal = "UN PKO")

# Get number of clusters
source("./functions/extract_ols_custom.R")


# custom functions to write tex output
source("./functions/custom_texreg.R")
environment(custom_texreg) <- asNamespace('texreg')

#
# # Output Manuscript
# custom_texreg(l = model_list,
#           stars = c(0.001, 0.01, 0.05, 0.1),
#           custom.coef.map = coef_name_map,
#        file = "../output/aid_ps_indeff_pubgoods.tex",
#           symbol = "+",
#           table = F,
#           booktabs = T,
#           use.packages = F,
#           dcolumn = T,
#           include.lr = F,
#           include.rsquared = F,
#                  include.cluster = T,
#
#           include.adjrs = T,
#         caption = "")
              # custom.multicol = T)
              # custom.model.names = c(" \\multicolumn{3}{c}{ \\textbf{Power-Sharing}} & \\multicolumn{3}{c}{ \\textbf{Foreign Aid}} \\\\ \\cmidrule(r){2-4} \\cmidrule(l){5-7} & \\multicolumn{1}{c}{(1)  }",
              #                        "\\multicolumn{1}{c}{(2)  }",
              #                        "\\multicolumn{1}{c}{(3)  }",
              #                        "\\multicolumn{1}{c}{(4)  }",
              #                        "\\multicolumn{1}{c}{(5)   }",
              #                        "\\multicolumn{1}{c}{(6)   }"))


# Output Replication Archive
htmlreg(l = model_list,
          stars = c(0.001, 0.01, 0.05, 0.1),
          custom.coef.map = coef_name_map,
          symbol = "+",
          table = F,
          booktabs = T,
          use.packages = F,

          dcolumn = T,
          include.lr = F,
          include.rsquared = F,
          include.adjrs = T,
          include.cluster = T,
        caption = "",
star.symbol = "\\*")| Model 1 | Model 2 | Model 3 | Model 4 | Model 5 | Model 6 | ||
|---|---|---|---|---|---|---|---|
| Power-Sharing (cabinet) | 0.01 | 0.01 | 0.01 | 0.01 | |||
| (0.04) | (0.04) | (0.03) | (0.04) | ||||
| Power-Sharing (senior) | 0.01 | ||||||
| (0.09) | |||||||
| Power-Sharing (nonsenior) | 0.01 | ||||||
| (0.05) | |||||||
| DGA/GDP (log) | -0.05 | ||||||
| (0.18) | |||||||
| Program Aid/GDP (log) | 0.21 | ||||||
| (0.16) | |||||||
| Budget Aid/GDP (log) | 0.16 | ||||||
| (0.11) | |||||||
| Aid / GDP (log) | -0.00 | -0.00 | -0.00 | 0.00 | -0.06 | -0.05 | |
| (0.06) | (0.06) | (0.06) | (0.06) | (0.06) | (0.06) | ||
| GDP p/c (log) | -0.34** | -0.34** | -0.34** | -0.35** | -0.28* | -0.33** | |
| (0.11) | (0.11) | (0.11) | (0.11) | (0.14) | (0.11) | ||
| Population (log) | 0.06 | 0.06 | 0.06 | 0.06 | 0.08 | 0.06 | |
| (0.09) | (0.09) | (0.09) | (0.09) | (0.09) | (0.09) | ||
| Conflict Intensity | 0.07 | 0.07 | 0.07 | 0.09 | 0.05 | 0.03 | |
| (0.22) | (0.22) | (0.22) | (0.23) | (0.22) | (0.22) | ||
| Non-State Violence | -0.93* | -0.93* | -0.93* | -0.95* | -0.91* | -0.88* | |
| (0.40) | (0.40) | (0.40) | (0.40) | (0.40) | (0.38) | ||
| Nat. Res. Rents | -0.00 | -0.00 | -0.00 | -0.00 | -0.00 | -0.00 | |
| (0.01) | (0.01) | (0.01) | (0.01) | (0.01) | (0.01) | ||
| Regime Type (FH) | 0.38*** | 0.38*** | 0.38*** | 0.39*** | 0.38*** | 0.37*** | |
| (0.08) | (0.08) | (0.08) | (0.08) | (0.08) | (0.08) | ||
| Num. obs. | 273 | 273 | 273 | 273 | 273 | 273 | |
| Countries | 46 | 46 | 46 | 46 | 46 | 46 | |
| Adj. R2 | 0.34 | 0.34 | 0.34 | 0.34 | 0.35 | 0.35 | |
| ***p < 0.001, **p < 0.01, *p < 0.05, +p < 0.1 | |||||||
Table 8.2: The Interaction Effect of Power-Sharing and Foreign Aid on Post-Conflict Provision of Public Goods
# Libraries
library(texreg)
source("functions/extract_ols_custom.R")
library(rms)


# load Data
load("./data/diss_df.rda")


# binary PS
model_aidps_spending_cabINC <- ols(v2dlencmps_t1 ~
                                     cabinetINC *
                                     aiddata_AidGDP_ln +
                                     ln_gdp_pc +
                                     ln_pop +
                                     conf_intens +
                                     nonstate +
                                     WBnatres +
                                     fh,
                                   data=diss_df, x=T, y=T)
model_aidps_spending_cabINC <- rms::robcov(model_aidps_spending_cabINC, diss_df$GWNo)


model_aidps_spending <- ols(v2dlencmps_t1 ~
                              cabinetCOUNT *
                              aiddata_AidGDP_ln +
                              ln_gdp_pc +
                              ln_pop +
                              conf_intens +
                              nonstate +
                              WBnatres +
                              fh,
                            data=diss_df, x=T, y=T)
model_aidps_spending <- rms::robcov(model_aidps_spending, diss_df$GWNo)


model_aidps_corr_cabinc <- ols(v2x_corr_t1 ~
                              cabinetINC *
                              aiddata_AidGDP_ln +
                              ln_gdp_pc +
                              ln_pop +
                              conf_intens +
                              nonstate +
                              log(WBnatres + 1) +
                              fh,
                            data=diss_df, x=T, y=T)
model_aidps_corr_cabinc <- rms::robcov(model_aidps_corr_cabinc, diss_df$GWNo)


model_aidps_corr <- ols(v2x_corr_t1 ~
                              cabinetCOUNT *
                              aiddata_AidGDP_ln +
                              ln_gdp_pc +
                              ln_pop +
                              conf_intens +
                              nonstate +
                              log(WBnatres + 1) +
                              fh,
                            data=diss_df, x=T, y=T)
model_aidps_corr <- rms::robcov(model_aidps_corr, diss_df$GWNo)


model_list <- list(model_aidps_spending_cabINC,
                   model_aidps_spending,
                   model_aidps_corr_cabinc,
                   model_aidps_corr)


coef_name_map <- list(
                      cabinetINC = "Power-Sharing (binary)",
                      "cabinetINC * aiddata_AidGDP_ln" = "Power-Sharing (binary) * Aid",
                      cabinetCOUNT = "Power-Sharing (cabinet)",
                      "cabinetCOUNT * aiddata_AidGDP_ln" = "Power-Sharing (cabinet) * Aid",
                      "cabinetCOUNT:aiddata_AidGDP_ln" = "PS (cabinet) * Aid",
                      ps_share = "PS (cabinet share)",
                      "ps_share * aiddata_AidGDP_ln" = "PS (cabinet share) * Aid",
                      dga_gdp_zero = "DGA/GDP (log)",
                      program_aid_gdp_zero = "Program Aid/GDP (log)",
                      commodity_aid_gdp_zero = "Budget Aid/GDP (log)",
                      aiddata_AidGDP_ln = "Aid / GDP (log)",

                      ln_gdp_pc = "GDP p/c (log)",
                      ln_pop = "Population (log)",
                      conf_intens = "Conflict Intensity",
                      nonstate = "Non-State Violence",
                      WBnatres = "Nat. Res. Rents",
                      polity2 = "Polity",
                      fh = "Regime Type (FH)",
                      Ethnic = "Ethnic Frac.",
                      DS_ordinal = "UN PKO")

# custom functions to write tex output
# source("functions/extract_ols_custom.R")
source("./functions/custom_texreg.R")
environment(custom_texreg) <- asNamespace('texreg')
#
# custom_texreg(model_list,
#               stars = c(0.001, 0.01, 0.05, 0.1),
#               custom.coef.map = coef_name_map,
#               symbol = "+",
#               file = "../output/psaid_pubgoods.tex",
#               table = F,
#               booktabs = T,
#               use.packages = F,
#               dcolumn = T,
#               custom.multicol = T,
#               custom.model.names = c(" \\multicolumn{2}{c}{ \\textbf{Public vs. Particularistic Spending}} & \\multicolumn{2}{c}{ \\textbf{Political Corruption}} \\\\ \\cmidrule(r){2-3} \\cmidrule(l){4-5} & \\multicolumn{1}{c}{(1)  }",
#                                      "\\multicolumn{1}{c}{(2)  }",
#                                      "\\multicolumn{1}{c}{(3)  }",
#                                      "\\multicolumn{1}{c}{(4)  }"),
#               include.cluster = T,
#               include.rsquared = F,
#               star.symbol = "\\*",
#               include.lr = F)

texreg::htmlreg(model_list,
                stars = c(0.001, 0.01, 0.05, 0.1),
                custom.coef.map = coef_name_map,
                symbol = "+",
        table = F,
        booktabs = T,
        use.packages = F,
        dcolumn = T,
        include.cluster = T,
        include.rsquared = F,
        star.symbol = "\\*",
        include.lr = F,
caption = "")| Model 1 | Model 2 | Model 3 | Model 4 | ||
|---|---|---|---|---|---|
| Power-Sharing (binary) | 0.92** | 0.03 | |||
| (0.29) | (0.06) | ||||
| Power-Sharing (binary) * Aid | -0.28* | -0.01 | |||
| (0.13) | (0.02) | ||||
| Power-Sharing (cabinet) | 0.12+ | 0.01 | |||
| (0.07) | (0.01) | ||||
| Power-Sharing (cabinet) * Aid | -0.04* | -0.00 | |||
| (0.02) | (0.00) | ||||
| Aid / GDP (log) | -0.02 | -0.00 | -0.00 | -0.00 | |
| (0.06) | (0.06) | (0.01) | (0.01) | ||
| GDP p/c (log) | -0.38*** | -0.37*** | -0.03 | -0.03 | |
| (0.10) | (0.11) | (0.02) | (0.02) | ||
| Population (log) | 0.06 | 0.06 | 0.02 | 0.02 | |
| (0.09) | (0.09) | (0.01) | (0.01) | ||
| Conflict Intensity | 0.13 | 0.11 | -0.04 | -0.04 | |
| (0.22) | (0.22) | (0.04) | (0.04) | ||
| Non-State Violence | -0.93* | -0.90* | 0.04 | 0.04 | |
| (0.40) | (0.41) | (0.03) | (0.03) | ||
| Nat. Res. Rents | -0.00 | -0.00 | 0.01 | 0.01 | |
| (0.01) | (0.01) | (0.01) | (0.01) | ||
| Regime Type (FH) | 0.40*** | 0.39*** | -0.06*** | -0.06*** | |
| (0.08) | (0.08) | (0.01) | (0.01) | ||
| Num. obs. | 273 | 273 | 273 | 273 | |
| Countries | 46 | 46 | 46 | 46 | |
| Adj. R2 | 0.37 | 0.35 | 0.42 | 0.42 | |
| ***p < 0.001, **p < 0.01, *p < 0.05, +p < 0.1 | |||||
Table 8.3: Robustness Checks: Power-Sharing, Foreign Aid and Post-Conflict Provision of Public Goods
# Libraries
library(texreg)
source("functions/extract_ols_custom.R")
source("./functions/extract_plm_custom.R")

library(rms)
library(countrycode)


# load Data
load("./data/diss_df.rda")


model_aidps_spending_ethnic <- ols(v2dlencmps_t1 ~
                              cabinetINC *
                              aiddata_AidGDP_ln +
                              ln_gdp_pc +
                              ln_pop +
                              conf_intens +
                              nonstate +
                              WBnatres +
                              fh +
                              Ethnic,
                            data=diss_df, x=T, y=T)
model_aidps_spending_ethnic <- rms::robcov(model_aidps_spending_ethnic, diss_df$GWNo)


model_aidps_spending_pko <- ols(v2dlencmps_t1 ~
                              cabinetINC *
                              aiddata_AidGDP_ln +
                              ln_gdp_pc +
                              ln_pop +
                              conf_intens +
                              nonstate +
                              WBnatres +
                              fh +
                              DS_ordinal,
                            data=diss_df, x=T, y=T)
model_aidps_spending_pko <- rms::robcov(model_aidps_spending_pko, diss_df$GWNo)

# Cabinet Share

library(readxl)
cnts <- read_excel("./data/CNTSDATA.xls")

cnts <- cnts %>% filter(year >= 1989)

cnts$iso3c <- countrycode(cnts$country, "country.name", "iso3c")
cnts <- cnts %>% filter(country != "SOMALILAND")

testcabsize <- left_join(diss_df, cnts[, c("iso3c", "year", "polit10")])

testcabsize$ps_share <- testcabsize$cabinetINC / testcabsize$polit10 * 100

model_cabsize_spending <- ols(v2dlencmps_t1 ~
                       ps_share *
                       aiddata_AidGDP_ln +
                       ln_gdp_pc +
                       ln_pop +
                       conf_intens +
                       nonstate +
                       WBnatres +
                       fh,
                     data = testcabsize, x = T, y = T)
model_cabsize_spending <- robcov(model_cabsize_spending, testcabsize$GWNo)

# personalist politics
personalist <- read_excel("./data/autoregime5.xls") %>%
  dplyr::select(cowcode, year, persagg1ny, persaggny2)


diss_df <- left_join(diss_df, personalist,
                  by = c("GWNo" = "cowcode", "year"))

model_aidps_spending_personalist <- ols(v2dlencmps_t1 ~
                                  cabinetINC *
                                  aiddata_AidGDP_ln +
                                  ln_gdp_pc +
                                  ln_pop +
                                  conf_intens +
                                  nonstate +
                                  WBnatres +
                                  fh +
                                    persaggny2,
                                data=diss_df, x=T, y=T)
model_aidps_spending_personalist <- rms::robcov(model_aidps_spending_personalist,
                                             diss_df$GWNo)

# Random Effects
library(plm)
model_aidps_spending_re <- plm(v2dlencmps_t1 ~
                                 cabinetINC *
                                 aiddata_AidGDP_ln +
                                 ln_gdp_pc +
                                 ln_pop +
                                 conf_intens +
                                 nonstate +
                                 WBnatres +
                                 fh,

                               data=diss_df, x=T, y=T,
                               model = "random",
                               index = c("GWNo", "year"))
series conflictID is NA and has been removed series conflictdummy, xnewconflictinyearv412, xonset1v412, xonset2v412, xonset5v412, xonset8v412, xonset20v412, xmaxintyearv412, xgovonlyv412, xterronlyv412, xbothgovterrv412, xsumconfv412, xpcyears, xis.pc, xcodingend are constants and have been removed
model_aidps_spending_re$vcov <- plm::vcovHC(model_aidps_spending_re)

# Region Fixed Effects
diss_df$regionFE <- countrycode(diss_df$Location, "country.name", "region")
diss_df$yearFE <- as.factor(diss_df$year)
model_aidps_spending_regionFE <- ols(v2dlencmps_t1 ~
                                  cabinetINC *
                                  aiddata_AidGDP_ln +
                                  ln_gdp_pc +
                                  ln_pop +
                                  conf_intens +
                                    nonstate +
                                    WBnatres +
                                    fh +
                                    regionFE ,
                                  data=diss_df, x=T, y=T)
model_aidps_spending_regionFE <- rms::robcov(model_aidps_spending_regionFE,
                                             diss_df$GWNo)

# model_aidps_spending_cntryFE <- lfe::felm(v2dlencmps_t1 ~
#                                   cabinetINC *
#                                   log(commodity_aid_gdp + 1) +
#                                     aiddata_AidGDP_ln +
#                                   ln_gdp_pc +
#                                   ln_pop +
#                                   conf_intens +
#                                     nonstate +
#                                     WBnatres +
#                                     fh | GWNo | 0 | GWNo,
#                                   data=diss_df, exactDOF = T)


model_list <- list(model_aidps_spending_ethnic,
                   model_aidps_spending_pko,
                   model_cabsize_spending,
                    model_aidps_spending_personalist,
                   model_aidps_spending_re,
                   model_aidps_spending_regionFE)

## Order of coefficients in output table
name_map_robustness <- list(cabinetINC = "Power-Sharing (binary)",
                            "cabinetINC * aiddata_AidGDP_ln" = "PS (binary) * Aid",
                            "cabinetINC:aiddata_AidGDP_ln" = "PS (binary) * Aid",
                            ps_share = "PS (cabinet share)",
                            "ps_share * aiddata_AidGDP_ln" = "PS (cabinet share) * Aid",
                            aiddata_AidGDP_ln = "Aid / GDP (log)",
                            ln_gdp_pc = "GDP p/c",
                            ln_pop = "Population",
                            conf_intens = "Conflict Intensity",
                            nonstate = "Non-State Violence",
                            WBnatres = "Nat. Res. Rents",
                            polity2 = "Polity",
                            fh = "Regime Type (FH)",
                            Ethnic = "Ethnic Frac.",
                            DS_ordinal = "UN PKO",
                            persaggny2 = "Personalism Index",
                            spending_regional_mean = "Part. Spending Regional Mean",
                            commonlaw = "Common Law",
                            duration_constitution = "Const. Duration")


source("./functions/custom_texreg.R")
environment(custom_texreg) <- asNamespace('texreg')

#
# # Output Manuscript
# custom_texreg(l = model_list,
#         stars = c(0.001, 0.01, 0.05, 0.1),
#         symbol = "+",
#         table = F,
#         booktabs = T,
#         use.packages = F,
#         dcolumn = T,
#         custom.coef.map = name_map_robustness,
#         file = "../output/aidps_spending_robustness.tex",
#         custom.model.names = c("(1) ELF",
#                                "(2) PKO",
#                                "(3) Cab. Size",
#                                "(4) Personalist Politics",
#                                "(5) RE",
#                                "(6) Region FE"),
#
#         star.symbol = "\\*",
#         include.lr = F,
#         include.cluster = T,
#         include.rsquared = F,
#         include.variance = F)

# Output Replication Archive
htmlreg(l = model_list,
        stars = c(0.001, 0.01, 0.05, 0.1),
        symbol = "+",
        table = F,
        booktabs = T,
        use.packages = F,
        dcolumn = T,
        custom.coef.map = name_map_robustness,
        # file = "../output/aidps_spending_robustness.tex",
        custom.model.names = c("(1) ELF",
                               "(2) PKO",
                               "(3) Cab. Size",
                               "(4) Personalist Politics",
                               "(5) RE",
                               "(6) Region FE"),

        star.symbol = "\\*",
        include.lr = F,
        include.cluster = T,
        include.rsquared = F,
include.variance = F)| (1) ELF | (2) PKO | (3) Cab. Size | (4) Personalist Politics | (5) RE | (6) Region FE | ||
|---|---|---|---|---|---|---|---|
| Power-Sharing (binary) | 0.89** | 0.94*** | 0.95** | 0.19+ | 0.44 | ||
| (0.31) | (0.25) | (0.29) | (0.10) | (0.31) | |||
| PS (binary) * Aid | -0.28* | -0.26* | -0.30* | -0.10* | -0.20+ | ||
| (0.13) | (0.12) | (0.14) | (0.05) | (0.11) | |||
| PS (cabinet share) | 0.27*** | ||||||
| (0.07) | |||||||
| PS (cabinet share) * Aid | -0.10*** | ||||||
| (0.02) | |||||||
| Aid / GDP (log) | -0.01 | -0.01 | 0.01 | -0.01 | 0.04 | 0.01 | |
| (0.06) | (0.06) | (0.07) | (0.06) | (0.03) | (0.06) | ||
| GDP p/c | -0.38*** | -0.38*** | -0.38*** | -0.37*** | 0.05 | -0.12 | |
| (0.10) | (0.10) | (0.10) | (0.11) | (0.27) | (0.13) | ||
| Population | 0.06 | 0.06 | 0.03 | 0.07 | 0.04 | 0.01 | |
| (0.09) | (0.09) | (0.10) | (0.08) | (0.10) | (0.08) | ||
| Conflict Intensity | 0.12 | 0.19 | 0.18 | 0.13 | -0.00 | 0.16 | |
| (0.20) | (0.21) | (0.24) | (0.21) | (0.08) | (0.19) | ||
| Non-State Violence | -0.95* | -0.94* | -0.92** | -0.95* | -0.24* | -0.96* | |
| (0.39) | (0.41) | (0.35) | (0.39) | (0.11) | (0.39) | ||
| Nat. Res. Rents | -0.00 | -0.00 | -0.00 | -0.00 | -0.01+ | 0.00 | |
| (0.01) | (0.01) | (0.01) | (0.01) | (0.01) | (0.01) | ||
| Regime Type (FH) | 0.40*** | 0.39*** | 0.37*** | 0.39*** | 0.13*** | 0.38*** | |
| (0.08) | (0.08) | (0.09) | (0.08) | (0.03) | (0.08) | ||
| Ethnic Frac. | 0.18 | ||||||
| (0.57) | |||||||
| UN PKO | -0.09 | ||||||
| (0.06) | |||||||
| Personalism Index | 0.39 | ||||||
| (0.54) | |||||||
| Num. obs. | 273 | 273 | 214 | 273 | 273 | 273 | |
| Countries | 46 | 46 | 42 | 46 | 46 | 46 | |
| Adj. R2 | 0.37 | 0.38 | 0.32 | 0.37 | 0.19 | 0.48 | |
| ***p < 0.001, **p < 0.01, *p < 0.05, +p < 0.1 | |||||||
Table 8.4: Power-Sharing, Foreign Aid and Post-Conflict Provision of Public Goods: Matching and 2SLS Results
# Libraries
library(texreg)
source("functions/extract_ols_custom.R")
library(rms)
library(countrycode)


# load Data
load("./data/diss_df.rda")


# 1. Matching -------------------------------------------------------------
library(MatchIt)
library(tidyr)

# prepare data without missings
match_spend_data <- diss_df %>%
  ungroup() %>%
  dplyr::select(cabinetINC, cabinetCOUNT, seniorINC,
                seniorCOUNT, nonseniorINC, nonseniorCOUNT,
                aiddata_AidGDP, population, nonstate,
                WBnatres, fh, GDP_per_capita, conf_intens,
                aiddata_AidGDP_ln, GWNo, year,
                # commodity_aid_gdp_ln,
                pc_period, Location, ln_pop, ln_gdp_pc,
                v2dlencmps_t1, v2x_corr_t1)

match_spend_data <- match_spend_data[complete.cases(match_spend_data), ]

# generate pretreatment controls
match_spend_data <- match_spend_data %>%
  arrange(GWNo, pc_period, year) %>%
  group_by(GWNo, pc_period) %>%
  mutate(match_aiddata_AidGDP_ln = first(aiddata_AidGDP_ln),
         match_pop = first(population),
         match_gdp = first(GDP_per_capita),
         match_nonstate = first(nonstate),
         match_WBnatres = first(WBnatres),
         match_fh = first(fh))

# convert back to data frame
match_spend_data <- as.data.frame(match_spend_data)


# 1.1 Perform Matching ----------------------------------------------------
set.seed(123)

# perform matching algorithm
match_spend_res <- matchit(cabinetINC ~
                          match_aiddata_AidGDP_ln +
                          log(match_gdp) +
                          log(match_pop) +
                          conf_intens + # conf_intens is already pre-treatment
                          match_nonstate +
                          log(match_WBnatres + 1)  +
                          match_fh ,
                        method = "nearest",
                        ratio = 2,
                        distance = "mahalanobis",
                        data = match_spend_data)

# extract data
match_spend_df <- match.data(match_spend_res)


# 1.3 Reestimate on matched sample ----------------------------------------

# all
model_spend_matched <- ols(v2dlencmps_t1 ~
                             cabinetINC *
                             aiddata_AidGDP_ln +
                             ln_gdp_pc +
                             ln_pop +
                             conf_intens +
                             nonstate +
                             WBnatres +
                             fh
                           ,
                           data=match_spend_df , x=T, y=T)
model_spend_matched <- rms::robcov(model_spend_matched, match_spend_df$GWNo)


# cabinetCOUNT
model_spend_matchedCOUNT <- ols(v2dlencmps_t1 ~
                             cabinetCOUNT *
                             aiddata_AidGDP_ln +
                             ln_gdp_pc +
                             ln_pop +
                             conf_intens +
                             nonstate +
                             WBnatres +
                             fh
                           ,
                           data=match_spend_df , x=T, y=T)
model_spend_matchedCOUNT <- rms::robcov(model_spend_matchedCOUNT, match_spend_df$GWNo)


# 2. Instrumental Variables -----------------------------------------------

# 2.1 Data Preparation ----------------------------------------------------


# load libraries
library(AER)
library(ivpack)
library(lmtest)

# load data with instrument; this gives "instrument_df" data frame
load(file = "./data/instrumentedAid2.RData")

diss_df_iv <- merge(diss_df,
                      instrument_df,
                      by = c("iso2c", "year"), all.x = TRUE)


# subset only complete.cases / necessary for cluster.robust.se()
iv_na <- na.omit(diss_df_iv[, c("cabinetCOUNT",
                                  "cabinetINC",
                                  "aiddata_Aid",
                                  "aiddata_AidGDP_ln",

                                  "fh",
                                  "GDP_per_capita",
                                  "population",
                                  "conf_intens",
                                  "WBnatres",
                                  "total_sum_except",
                                  "year",
                                  "GWNo",
                                  "GDP",
                                  "nonstate",
                                  "v2dlencmps_t1",
                                  "v2x_corr_t1")])


# 2.2 Reduced Form ---------------------------------------------------------


# # reduced form:
# reduced_form_spending <- ols(v2dlencmps_t1 ~
#                                cabinetINC *
#                                log(total_sum_except / GDP) +
#                                log(dga_gdp + 0.001) +
#                                log(program_aid_gdp + + 0.001) +
#                                log(GDP_per_capita) +
#                                log(population) +
#                                conf_intens +
#                                nonstate +
#                                fh,
#                              data=iv_na, x=T, y=T)
# reduced_form_spending <- robcov(reduced_form_spending, iv_na$GWNo)
#
#
# reduced_form_corr <- ols(v2x_corr_t1 ~
#                                cabinetCOUNT *
#                                log(total_sum_except / GDP) +
#                                log(GDP_per_capita) +
#                                log(population) +
#                                conf_intens +
#                                nonstate +
#                                fh +
#                                polity2,
#                              data=iv_na, x=T, y=T)
# reduced_form_corr  <- robcov(reduced_form_corr , iv_na$GWNo)


# 2.3 IV Analysis -------------------------------------------------------------

# to proceed with IV estimation I first hard-code the instrument
iv_na$instr_aid_gdp_ln <- log(iv_na$total_sum_except / iv_na$GDP)

# data transformation for Stata
iv_na$ln_gdp_pc <- log(iv_na$GDP_per_capita)
iv_na$ln_pop <- log(iv_na$population)
# iv_na$dga_gdp_ln <- log(iv_na$dga_gdp + 0.01)
# iv_na$program_aid_gdp_ln <- log(iv_na$program_aid_gdp + 0.01)

# and save data to Stata format
foreign::write.dta(iv_na, "./data/iv_na_spending.dta")


# hard code interaction variable
iv_na$cabincXaid <- iv_na$aiddata_AidGDP_ln * iv_na$cabinetINC
iv_na$cabincXaid_instr <- iv_na$instr_aid_gdp_ln * iv_na$cabinetINC


library(lfe)
iv_spending <- felm(v2dlencmps_t1 ~
                      cabinetINC +  # outcome equation / 2nd stage regression


                      ln_gdp_pc +
                      ln_pop +
                      conf_intens +
                      nonstate +
                       WBnatres +
                       fh
                       | 0 | (aiddata_AidGDP_ln|cabincXaid ~
                                instr_aid_gdp_ln + cabincXaid_instr) | GWNo,
                       data = iv_na)

# Output
model_list <- list(model_spend_matched,
                   iv_spending)


## Order of coefficients in output table
name_map_robustness <- list(cabinetINC = "Power-Sharing (binary)",
                 "cabinetINC * aiddata_AidGDP_ln" = "Power-Sharing (binary) * Aid",

                 "`cabincXaid(fit)`" = "Power-Sharing (binary) * Aid",
                 "`aiddata_AidGDP_ln(fit)`" = "Aid / GDP (log)",
                 "aiddata_AidGDP_ln" = "Aid / GDP (log)",

                 "ln_gdp_pc" = "GDP p/c",
                 "ln_pop" = "Population",
                 conf_intens = "Conflict Intensity",
                 nonstate = "Non-State Violence",
                 WBnatres = "Nat. Res. Rents",
                 polity2 = "Regime Type",
                 fh = "Regime Type")

source("./functions/custom_texreg.R")
environment(custom_texreg) <- asNamespace('texreg')

source("./functions/custom_texreg.R")
environment(custom_texreg) <- asNamespace('texreg')
source("functions/extract_felm_custom.R")


# # Output Manuscript
# custom_texreg(l = model_list,
#         stars = c(0.001, 0.01, 0.05, 0.1),
#         symbol = "+",
#         table = F,
#         booktabs = T,
#         use.packages = F,
#         dcolumn = T,
#         custom.coef.map = name_map_robustness,
#         file = "../output/aidps_spending_endogeneity.tex",
#         custom.model.names = c("(1) Matching",
#                                "(2) 2SLS"),
#
#         star.symbol = "\\*",
#         include.lr = F,
#         include.cluster = F,
#          add.lines = list(c("Countries",
#                                  length(unique(match_spend_df$GWNo)),
#                                  length(unique(diss_df$GWNo))),
#                                c("Kleibergen-Paap rk Wald F statistic",
#                                  "",
#                                  "43.11")),
#         include.rsquared = F,
#         include.variance = F)
Supplement: Stata code to generate F-Statistics for IV/2SLS models
use "./data/iv_na_spending.dta", clear

* Generate interactions & interactions with instrument
gen cabXaid = cabinetINC * aiddata_AidGDP_ln
gen cabXaid_instr = cabinetINC * instr_aid_gdp_ln


ivreg2 v2dlencmps_t1 cabinetINC ln_gdp_pc ln_pop nonstate conf_intens WBnatres fh ///
(aiddata_AidGDP_ln cabXaid = instr_aid_gdp_ln cabXaid_instr), cluster(GWNo) first
LS0tDQp0aXRsZTogIkNoYXB0ZXIgODogUHVibGljIEdvb2RzIg0Kb3V0cHV0OiANCiAgaHRtbF9kb2N1bWVudDoNCiAgICB0b2M6IHRydWUNCiAgICB0b2NfZmxvYXQ6IA0KICAgICAgY29sbGFwc2VkOiBmYWxzZQ0KICAgIGNvZGVfZG93bmxvYWQ6IHRydWUNCiAgICBjb2RlX2ZvbGRpbmc6ICJoaWRlIg0KDQotLS0NCg0KIyBGaWd1cmUgOC4xOiBQdWJsaWMgR29vZHMsIFBvd2VyLVNoYXJpbmcsIGFuZCBBaWQ6IEluZGl2aWR1YWwgUGF0dGVybnMNCg0KYGBge3IsIGZpZy5hbGlnbiA9ICJjZW50ZXIiLCBtZXNzYWdlPUYsIHdhcm5pbmc9RiwgY2FjaGUgPSBULCBjb21tZW50cyA9IEYsIGZpZy5oZWlnaHQgPSAzLjUsZGV2ID0gIkNhaXJvUE5HIiB9DQojIExpYnJhcmllcw0KbGlicmFyeSh0aWR5dmVyc2UpDQpsaWJyYXJ5KGNvd3Bsb3QpDQpsaWJyYXJ5KGxmZSkNCmxpYnJhcnkodGlrekRldmljZSkNCg0KIyBEYXRhDQpsb2FkKCIuL2RhdGEvZGlzc19kZi5yZGEiKQ0KDQoNCiMgZ2VuZXJhdGUgY2FiaW5ldElOQyBsYWJlbCB2YXJpYWJsZSBmb3IgcGxvdHRpbmcNCmRpc3NfZGYkY2FiaW5ldElOQ2xhYmVsIDwtIGlmZWxzZShkaXNzX2RmJGNhYmluZXRJTkMgPT0gMSwgIlBvd2VyLVNoYXJpbmciLCANCiAgICAgICAgICAgICAgICAgICAgICAgICAgICAgICAgICAgICJObyBQb3dlci1TaGFyaW5nIikNCg0KcGxvdF9wc19zcGVuZGluZyA8LSBnZ3Bsb3QoZGlzc19kZiwgYWVzKHggPSBjYWJpbmV0SU5DbGFiZWwsIHkgPSB2MmRsZW5jbXBzX3QxKSkgKyANCiAgZ2VvbV9qaXR0ZXIoc2l6ZSA9IDEuNywgYWxwaGEgPSAwLjUpICsNCiAgZ2VvbV9ib3hwbG90KGFlcyhmaWxsID0gY2FiaW5ldElOQ2xhYmVsKSwgYWxwaGEgPSAwLjYpICsNCiAgc2NhbGVfZmlsbF9icmV3ZXIocGFsZXR0ZSA9ICJCbHVlcyIpICsgDQogIHN0YXRfc3VtbWFyeShhZXMoZ3JvdXAgPSAxKSwgZnVuLnkgPSBtZWFuLCBnZW9tID0gInBvaW50Iiwgc2hhcGUgPSAyMywNCiAgICAgICAgICAgICAgIHNpemUgPSA0LCBmaWxsID0gIiNkNzE5MWMiLCBjb2xvciA9ICIjZDcxOTFjIikgKyANCiAgdGhlbWVfYncoKSArDQogIHRoZW1lKGxlZ2VuZC5wb3NpdGlvbiA9ICJub25lIiwgYXhpcy50ZXh0ID0gZWxlbWVudF90ZXh0KHNpemUgPSAxMSkpICsNCiAgbGFicyh4ID0gIiIsIHkgPSAiUGFydGljdWxhcmlzdGljIHZzLiBQdWJsaWMgU3BlbmRpbmciKQ0KDQoNCnBsb3RfYWxsYWlkX3NwZW5kaW5nIDwtIGdncGxvdChkaXNzX2RmLCANCiAgICAgICAgICAgICAgICAgICAgICAgICAgICAgICBhZXMoeCA9IGxvZyhhaWRkYXRhX0FpZEdEUCksIA0KICAgICAgICAgICAgICAgICAgICAgICAgICAgICAgICAgICB5ID0gdjJkbGVuY21wc190MSkpICsgDQogIGdlb21fcG9pbnQoYWxwaGEgPSAwLjUsIHNpemUgPSAxLjcpICsNCiAgZ2VvbV9zbW9vdGgobWV0aG9kID0gImxtIikgKw0KICB0aGVtZV9idygpICsNCiAgbGFicyh4ID0gIkFsbCBBaWQgLyBHRFAgKGxvZykiLCANCiAgICAgICB5ID0gIlBhcnRpY3VsYXJpc3RpYy4gdnMuIFB1YmxpYyBTcGVuZGluZyIpIA0KDQoNCiMgT3V0cHV0IGZvciBNYW51c2NyaXB0DQojIG9wdGlvbnMoIHRpa3pEb2N1bWVudERlY2xhcmF0aW9uID0gIlxcZG9jdW1lbnRjbGFzc1sxMXB0XXthcnRpY2xlfSIgKQ0KIyB0aWt6KCIuLi9maWd1cmVzL2FpZF9wc19pbmRpdmlkX3NwZW5kaW5nLnRleCIsIGhlaWdodCA9IDMuNSkNCiMgZ3JpZEV4dHJhOjpncmlkLmFycmFuZ2UocGxvdF9wc19zcGVuZGluZywgcGxvdF9hbGxhaWRfc3BlbmRpbmcsIG5yb3cgPSAxKQ0KIyBkZXYub2ZmKCkNCg0KIyBPdXRwdXQgZm9yIFJlcC4gQXJjaGl2ZQ0KZ3JpZEV4dHJhOjpncmlkLmFycmFuZ2UocGxvdF9wc19zcGVuZGluZywgcGxvdF9hbGxhaWRfc3BlbmRpbmcsIG5yb3cgPSAxKQ0KDQoNCmBgYA0KDQoNCg0KIyBGaWd1cmUgOC4yOiBGb3JlaWduIEFpZCBhbmQgUGFydGljdWxhcmlzdGljIHZzLiBQdWJsaWMgR29vZHMgU3BlbmRpbmcgaW4gQ291bnRyeS1ZZWFycyBXaXRoIGFuZCBXaXRob3V0IFBvd2VyLVNoYXJpbmcgR292ZXJubWVudHMNCg0KYGBge3IsIGZpZy5hbGlnbiA9ICJjZW50ZXIiLCBtZXNzYWdlPUYsIHdhcm5pbmc9RiwgY2FjaGUgPSBULCBjb21tZW50cyA9IEYsIGZpZy5oZWlnaHQgPSAzLjUsZGV2ID0gIkNhaXJvUE5HIiB9DQojIExpYnJhcmllcw0KbGlicmFyeSh0aWR5dmVyc2UpDQpsaWJyYXJ5KGNvd3Bsb3QpDQpsaWJyYXJ5KGxmZSkNCmxpYnJhcnkodGlrekRldmljZSkNCg0KIyBEYXRhDQpsb2FkKCIuL2RhdGEvZGlzc19kZi5yZGEiKQ0KDQoNCiMgZ2VuZXJhdGUgY2FiaW5ldElOQyBsYWJlbCB2YXJpYWJsZSBmb3IgcGxvdHRpbmcNCmRpc3NfZGYkY2FiaW5ldElOQ2xhYmVsIDwtIGlmZWxzZShkaXNzX2RmJGNhYmluZXRJTkMgPT0gMSwgIlBvd2VyLVNoYXJpbmciLCANCiAgICAgICAgICAgICAgICAgICAgICAgICAgICAgICAgICAgICJObyBQb3dlci1TaGFyaW5nIikNCiMgZ2VuZXJhdGUgcGxvdA0KcGxvdF9haWRwc19zcGVuZGluZyA8LSBnZ3Bsb3QoZGlzc19kZiwgDQogICAgICAgICAgICAgICAgICAgICAgICAgICAgICAgYWVzKHggPSBsb2coYWlkZGF0YV9BaWRHRFApLCANCiAgICAgICAgICAgICAgICAgICAgICAgICAgICAgICAgICAgeSA9IHYyZGxlbmNtcHNfdDEpKSArIA0KICBnZW9tX3BvaW50KGFscGhhID0gMC41KSArDQogIGdlb21fc21vb3RoKG1ldGhvZCA9ICJsbSIpICsNCiAgZmFjZXRfd3JhcCh+IGNhYmluZXRJTkNsYWJlbCkgKyANCiAgdGhlbWVfYncoKSArDQogIGxhYnMoeCA9ICJBbGwgQWlkIC8gR0RQIChsb2cpIiwgDQogICAgICAgeSA9ICJQYXJ0aWN1bGFyaXN0aWMuIHZzLiBQdWJsaWMgU3BlbmRpbmciKSANCg0KIyBPdXRwdXQgZm9yIE1hbnVzY3JpcHQNCiMgb3B0aW9ucyggdGlrekRvY3VtZW50RGVjbGFyYXRpb24gPSAiXFxkb2N1bWVudGNsYXNzWzExcHRde2FydGljbGV9IiApDQojIHRpa3ooIi4uL2ZpZ3VyZXMvYWlkcHNfc3BlbmRpbmdfcGxvdC50ZXgiLCBoZWlnaHQgPSAzLjUpDQojIHByaW50KHBsb3RfYWlkcHNfc3BlbmRpbmcpDQojIGRldi5vZmYoKQ0KDQojIE91dHB1dCBmb3IgUmVwLiBBcmNoaXZlDQpwcmludChwbG90X2FpZHBzX3NwZW5kaW5nKQ0KDQpgYGAgDQoNCiMgRmlndXJlIDguMzogVGVtcG9yYWwgRHluYW1pY3Mgb2YgdGhlIEludGVyYWN0aXZlIEVmZmVjdCBiZXR3ZWVuIFBvd2VyLVNoYXJpbmcgYW5kIEZvcmVpZ24gQWlkIG9uIFB1YmxpYyBHb29kcyBQcm92aXNpb24NCmBgYHtyLCBmaWcuYWxpZ24gPSAiY2VudGVyIiwgbWVzc2FnZT1GLCB3YXJuaW5nPUYsIGNhY2hlID0gVCwgY29tbWVudHMgPSBGLCBmaWcuaGVpZ2h0ID0gMy41LCBkZXYgPSAiQ2Fpcm9QTkciIH0NCg0KIyBMaWJyYXJpZXMNCmxpYnJhcnkodGlkeXZlcnNlKQ0KbGlicmFyeShjb3dwbG90KQ0KbGlicmFyeShsZmUpDQpsaWJyYXJ5KHRpa3pEZXZpY2UpDQoNCg0KIyBEYXRhDQpsb2FkKCIuL2RhdGEvZGlzc19kZi5yZGEiKQ0KDQpkaXNzX2RmIDwtIGRpc3NfZGYgJT4lIA0KICBkcGx5cjo6c2VsZWN0KC1tYXRjaGVzKCJsb2dpdCIpKSANCg0KIyBQcmVwYXJlIGRhdGEgZnJhbWUgZm9yIG11bHRpcGxlIHBsb3RzDQpzcGVuZGluZ192YXJzIDwtIGxpc3QoDQogIHYyZGxlbmNtcHNfdDEgPSBkaXNzX2RmLA0KICB2MmRsZW5jbXBzX3QyID0gZGlzc19kZiwgDQogIHYyZGxlbmNtcHNfdDMgPSBkaXNzX2RmLCANCiAgdjJkbGVuY21wc190NCA9IGRpc3NfZGYsIA0KICB2MmRsZW5jbXBzX3Q1ID0gZGlzc19kZiwgDQogIHYyeF9jb3JyX3QxID0gZGlzc19kZiwNCiAgdjJ4X2NvcnJfdDIgPSBkaXNzX2RmLCANCiAgdjJ4X2NvcnJfdDMgPSBkaXNzX2RmLCANCiAgdjJ4X2NvcnJfdDQgPSBkaXNzX2RmLCANCiAgdjJ4X2NvcnJfdDUgPSBkaXNzX2RmDQopDQoNCiMgY3JlYXRlIGRhdGEgZnJhbWUgd2l0aCBsaXN0IGNvbHVtbg0Kc3BlbmRpbmdfdmFycyA8LSBlbmZyYW1lKHNwZW5kaW5nX3ZhcnMpDQoNCiMgZGVmaW5lIGZ1bmN0aW9uIHRoYXQgd2lsbCBiZSBhcHBsaWVkIHRvIGV2ZXJ5IGRhdGEgZnJhbWUgaW4gdGhlIGxpc3QgY29sdW1uDQptYWluX21vZGVsIDwtIGZ1bmN0aW9uKGxlYWRfdHlwZSwgZGF0YSkgew0KICBkYXRhIDwtIGFzLmRhdGEuZnJhbWUoZGF0YSkNCiAgZGF0YSRsZWFkX3ZhciA8LSBkYXRhWywgZ3JlcChsZWFkX3R5cGUsIG5hbWVzKGRhdGEpLCB2YWx1ZSA9VCldDQogIG1vZGVsIDwtIGxmZTo6ZmVsbShsZWFkX3ZhciB+DQogICAgICAgICAgICAgICAgICAgICAgIGNhYmluZXRDT1VOVCAqDQogICAgICAgICAgICAgICAgICAgICAgIGFpZGRhdGFfQWlkR0RQX2xuICsNCiAgICAgICAgICAgICAgICAgICAgICAgbG9nKEdEUF9wZXJfY2FwaXRhKSArDQogICAgICAgICAgICAgICAgICAgICAgIGxuX3BvcCArDQogICAgICAgICAgICAgICAgICAgICAgIGNvbmZfaW50ZW5zICsNCiAgICAgICAgICAgICAgICAgICAgICAgbm9uc3RhdGUgKw0KICAgICAgICAgICAgICAgICAgICAgICBXQm5hdHJlcyArDQogICAgICAgICAgICAgICAgICAgICAgIGZoIHwgMCB8IDAgfCBHV05vLA0KICAgICAgICAgICAgICAgICAgICAgZGF0YT1kYXRhKQ0KICByZXR1cm4obW9kZWwpDQoNCn0NCg0KDQojIGZpdCBtb2RlbHMgJiBwb3N0LXByb2Nlc3MgZGF0YSBmb3IgcGxvdHRpbmcNCm1vZGVsX2FsbCA8LSBzcGVuZGluZ192YXJzICU+JSANCiAgZHBseXI6Om11dGF0ZShtb2RlbCA9IG1hcDIobmFtZSwgdmFsdWUsIH4gbWFpbl9tb2RlbCgueCwgLnkpKSkgDQoNCm1vZGVsX291dCA8LSBtb2RlbF9hbGwgJT4lIA0KICBtdXRhdGUoY29lZiA9IG1hcChtb2RlbCwgYnJvb206OnRpZHkpKSAlPiUgDQogIHVubmVzdChjb2VmKSAlPiUgDQogICMga2VlcCBvbmx5IGludGVyYWN0aW9uIHRlcm0gY29lZnMNCiAgZmlsdGVyKHRlcm0gPT0gImNhYmluZXRDT1VOVDphaWRkYXRhX0FpZEdEUF9sbiIpICU+JSANCiAgbXV0YXRlKGRlbV9zY29yZSA9IGlmZWxzZShncmVwbCgidjJkbGVuY21wcyIsIG5hbWUpLCAiUHVibGljIHZzLiBQYXJ0aWN1bGFyaXN0aWMgU3BlbmRpbmciLCAiUG9saXRpY2FsIENvcnJ1cHRpb24iKSkgJT4lIA0KICBkcGx5cjo6c2VsZWN0KGRlbV9zY29yZSwgbmFtZSwgZXN0aW1hdGUsIHN0ZC5lcnJvcikgJT4lIA0KICBncm91cF9ieShkZW1fc2NvcmUpICU+JSANCiAgbXV0YXRlKG5hbWUgPSAxOjUpDQoNCg0KDQp0ZW1wX2R5bl9wdWJnb29kcyA8LSBtb2RlbF9vdXQNCnNhdmUodGVtcF9keW5fcHViZ29vZHMsIGZpbGUgPSAiLi9kYXRhL3RlbXBfZHluX3B1Ymdvb2RzLnJkYSIpDQoNCg0KdGVtcF9keW5hbWljc19wbG90IDwtIGdncGxvdChtb2RlbF9vdXQsIA0KICAgICAgICAgICAgICAgICAgICAgICAgICAgICBhZXMoeCA9IG5hbWUsIA0KICAgICAgICAgICAgICAgICAgICAgICAgICAgICAgICAgeSA9IGVzdGltYXRlLA0KICAgICAgICAgICAgICAgICAgICAgICAgICAgICAgICAgZ3JvdXAgPSBkZW1fc2NvcmUsIGNvbG9yID0gZGVtX3Njb3JlKSkgKw0KICBnZW9tX3BvaW50KCBhZXMoZ3JvdXAgPSBkZW1fc2NvcmUpLCBzaXplID0gMS43LCANCiAgICAgICAgICAgICAgcG9zaXRpb24gPSBwb3NpdGlvbl9kb2RnZSh3aWR0aCA9IC41KSkgKyANCiAgDQogIGdlb21fZXJyb3JiYXIoYWVzKHltaW4gPSBlc3RpbWF0ZSAtIDEuNjcgKiBzdGQuZXJyb3IsIA0KICAgICAgICAgICAgICAgICAgICB5bWF4ID0gZXN0aW1hdGUgKyAxLjY3ICogc3RkLmVycm9yLCANCiAgICAgICAgICAgICAgICAgICAgbGluZXR5cGUgPSBkZW1fc2NvcmUpLCANCiAgICAgICAgICAgICAgICB3aWR0aCA9IDAsDQogICAgICAgICAgICAgICAgcG9zaXRpb24gPSBwb3NpdGlvbl9kb2RnZSh3aWR0aCA9IC41KSkgKw0KICANCiAgZ2VvbV9obGluZSh5aW50ZXJjZXB0ID0gMCwgbGluZXR5cGUgPSAyKSArDQogIHNjYWxlX2NvbG9yX21hbnVhbCgiIiwgdmFsdWVzID0gYygiIzQ1NzViNCIsICIjZTQxYTFjIikpICsNCiAgc2NhbGVfbGluZXR5cGVfbWFudWFsKCIiLCB2YWx1ZXMgPSBjKDEsIDUpKSArDQogIHRoZW1lX2J3KCkrIA0KICBsYWJzKHggPSAiWWVhciBhZnRlciB0MCIsIHkgPSAiRXN0aW1hdGUgb2YgSW50ZXJhY3Rpb24gQ29lZmZpY2llbnQgXG4gYmV0d2VlbiBQb3dlci1TaGFyaW5nIChjYWJpbmV0KVxuIGFuZCBBaWQvR0RQIChsb2cpIikgKw0KICAgdGhlbWUobGVnZW5kLnBvc2l0aW9uID0gImJvdHRvbSIpICsNCiAgdGhlbWUobGVnZW5kLmtleS5zaXplPXVuaXQoMywibGluZXMiKSkgIyArDQogICMgYW5ub3RhdGUoInJlY3QiLCB4bWluPTEuNSwgeG1heD0yLjUsIHltaW49LUluZiwgeW1heD1JbmYsIGFscGhhPS4xLCBmaWxsPSJibHVlIikNCg0KIyBPdXRwdXQgZm9yIG1hbnVzY3JpcHQNCiMgb3B0aW9ucyh0aWt6RG9jdW1lbnREZWNsYXJhdGlvbiA9ICJcXGRvY3VtZW50Y2xhc3NbMTFwdF17YXJ0aWNsZX0iICkNCiMgdGlreigiLi4vZmlndXJlcy90ZW1wX2R5bmFtaWNzX3Bsb3Rfc3BlbmRpbmcudGV4IiwgaGVpZ2h0ID0gMy41KQ0KIyBwcmludCh0ZW1wX2R5bmFtaWNzX3Bsb3QpDQojIGRldi5vZmYoKQ0KDQojIE91dHB1dCBmb3IgcmVwbGljYXRpb24gYXJjaGl2ZQ0KcHJpbnQodGVtcF9keW5hbWljc19wbG90KQ0KDQpgYGANCg0KDQojIEZpZ3VyZSA4LjQ6IE1hcmdpbmFsIEVmZmVjdHMgb2YgUG93ZXItU2hhcmluZyBhbmQgRm9yZWlnbiBBaWQgb24gUGFydGljdWxhcmlzdGljIHZzLiBQcml2YXRlIFNwZW5kaW5nDQoNCmBgYHtyLCBmaWcuYWxpZ24gPSAiY2VudGVyIiwgbWVzc2FnZT1GLCB3YXJuaW5nPUYsIGNhY2hlID0gVCwgY29tbWVudHMgPSBGLCBmaWcud2lkdGggPSA4LCBmaWcuaGVpZ2h0PTMuNSwgZGV2ID0gIkNhaXJvUE5HIn0NCg0KIyBMaWJyYXJpZXMNCmxpYnJhcnkodGlkeXZlcnNlKQ0KbGlicmFyeShybXMpDQpsaWJyYXJ5KGdyaWRFeHRyYSkNCmxpYnJhcnkodGlrekRldmljZSkNCg0KIyBMb2FkIGRhdGENCmxvYWQoImRhdGEvZGlzc19kZi5yZGEiKQ0KDQojIEVzdGltYXRlIE1vZGVscw0KDQoNCg0KIyBiaW5hcnkgUFMNCm1vZGVsX2FpZHBzX3NwZW5kaW5nX2NhYklOQyA8LSBvbHModjJkbGVuY21wc190MSB+DQogICAgICAgICAgICAgICAgICAgICAgICAgICAgICAgICAgICAgY2FiaW5ldElOQyAqICANCiAgICAgICAgICAgICAgICAgICAgICAgICAgICAgICAgICAgICBhaWRkYXRhX0FpZEdEUF9sbiArDQogICAgICAgICAgICAgICAgICAgICAgICAgICAgICAgICAgICAgbG5fZ2RwX3BjICsNCiAgICAgICAgICAgICAgICAgICAgICAgICAgICAgICAgICAgICBsbl9wb3AgKw0KICAgICAgICAgICAgICAgICAgICAgICAgICAgICAgICAgICAgIGNvbmZfaW50ZW5zICsNCiAgICAgICAgICAgICAgICAgICAgICAgICAgICAgICAgICAgICBub25zdGF0ZSArDQogICAgICAgICAgICAgICAgICAgICAgICAgICAgICAgICAgICAgV0JuYXRyZXMgKyANCiAgICAgICAgICAgICAgICAgICAgICAgICAgICAgICAgICAgICBmaCwNCiAgICAgICAgICAgICAgICAgICAgICAgICAgICAgICAgICAgZGF0YT1kaXNzX2RmLCB4PVQsIHk9VCkNCm1vZGVsX2FpZHBzX3NwZW5kaW5nX2NhYklOQyA8LSBybXM6OnJvYmNvdihtb2RlbF9haWRwc19zcGVuZGluZ19jYWJJTkMsIGRpc3NfZGYkR1dObykNCg0KDQptb2RlbF9haWRwc19zcGVuZGluZyA8LSBvbHModjJkbGVuY21wc190MSB+DQogICAgICAgICAgICAgICAgICAgICAgICAgICAgICBjYWJpbmV0Q09VTlQgKiAgDQogICAgICAgICAgICAgICAgICAgICAgICAgICAgICBhaWRkYXRhX0FpZEdEUF9sbiArDQogICAgICAgICAgICAgICAgICAgICAgICAgICAgICBsbl9nZHBfcGMgKw0KICAgICAgICAgICAgICAgICAgICAgICAgICAgICAgbG5fcG9wICsNCiAgICAgICAgICAgICAgICAgICAgICAgICAgICAgIGNvbmZfaW50ZW5zICsNCiAgICAgICAgICAgICAgICAgICAgICAgICAgICAgIG5vbnN0YXRlICsNCiAgICAgICAgICAgICAgICAgICAgICAgICAgICAgIFdCbmF0cmVzICsgDQogICAgICAgICAgICAgICAgICAgICAgICAgICAgICBmaCwNCiAgICAgICAgICAgICAgICAgICAgICAgICAgICBkYXRhPWRpc3NfZGYsIHg9VCwgeT1UKQ0KbW9kZWxfYWlkcHNfc3BlbmRpbmcgPC0gcm1zOjpyb2Jjb3YobW9kZWxfYWlkcHNfc3BlbmRpbmcsIGRpc3NfZGYkR1dObykNCg0KDQoNCiMgR2VuZXJhdGUgTUUgcGxvdHMNCg0Kc291cmNlKCJmdW5jdGlvbnMvaW50ZXJhY3Rpb25fcGxvdHMuUiIpDQoNCiMgDQojICMgT3V0cHV0IGZvciBtYW51c2NyaXB0DQojIG9wdGlvbnModGlrekRvY3VtZW50RGVjbGFyYXRpb24gPSAiXFxkb2N1bWVudGNsYXNzWzExcHRde2FydGljbGV9IiApDQojIHRpa3ooIi4uL2ZpZ3VyZXMvaW50ZXJhY3Rpb25fc3BlbmRpbmcudGV4IiwgaGVpZ2h0ID0gMy41KQ0KIyANCiMgDQojIHBhcihtZnJvdz1jKDEsMyksDQojICAgICBtYXIgPSBjKDUsIDcsIDQsIDAuNSksDQojICAgICBjZXgubGFiID0gMS4zLA0KIyAgICAgY2V4LmF4aXMgPSAxLjMsDQojICAgICBtZ3AgPSBjKDMuNSwgMSwgMCkpDQojIA0KIyBpbnRlcmFjdGlvbl9wbG90X2NvbnRpbnVvdXMobW9kZWxfYWlkcHNfc3BlbmRpbmcsIA0KIyAgICAgICAgICAgICAgICAgICAgICAgICAgICAgImNhYmluZXRDT1VOVCIsIA0KIyAgICAgICAgICAgICAgICAgICAgICAgICAgICAgImFpZGRhdGFfQWlkR0RQX2xuIiwgDQojICAgICAgICAgICAgICAgICAgICAgICAgICAgICAiY2FiaW5ldENPVU5UICogYWlkZGF0YV9BaWRHRFBfbG4iLCANCiMgICAgICAgICAgICAgICAgICAgICAgICAgICAgIHRpdGxlID0gIiIsIA0KIyAgICAgICAgICAgICAgICAgICAgICAgICAgICAgeWxhYiA9ICJNYXJnaW5hbCBlZmZlY3Qgb2YgUG93ZXItU2hhcmluZyAoY2FiaW5ldCkgXG4gb24gUHVibGljIHZzLiBQYXJ0aWN1bGFyaXN0aWMgU3BlbmRpbmciLCANCiMgICAgICAgICAgICAgICAgICAgICAgICAgICAgIGFkZF9tZWRpYW5fZWZmZWN0ID0gVCwNCiMgICAgICAgICAgICAgICAgICAgICAgICAgICAgIHhsYWIgPSAiYSkgQWlkIC8gR0RQIChMb2cpXG4iLCANCiMgICAgICAgICAgICAgICAgICAgICAgICAgICAgIGNvbmYgPSAuOTApDQojIGludGVyYWN0aW9uX3Bsb3RfY29udGludW91cyhtb2RlbF9haWRwc19zcGVuZGluZywgDQojICAgICAgICAgICAgICAgICAgICAgICAgICAgICAiYWlkZGF0YV9BaWRHRFBfbG4iLCANCiMgICAgICAgICAgICAgICAgICAgICAgICAgICAgICJjYWJpbmV0Q09VTlQiLCANCiMgICAgICAgICAgICAgICAgICAgICAgICAgICAgICJjYWJpbmV0Q09VTlQgKiBhaWRkYXRhX0FpZEdEUF9sbiIsIA0KIyAgICAgICAgICAgICAgICAgICAgICAgICAgICAgdGl0bGUgPSAiIiwgDQojICAgICAgICAgICAgICAgICAgICAgICAgICAgICBhZGRfbWVkaWFuX2VmZmVjdCA9IFQsDQojICAgICAgICAgICAgICAgICAgICAgICAgICAgICB5bGFiID0gIk1hcmdpbmFsIGVmZmVjdCBvZiBBaWRcbiBvbiBQdWJsaWMgdnMuIFBhcnRpY3VsYXJpc3RpYyBTcGVuZGluZyIsDQojICAgICAgICAgICAgICAgICAgICAgICAgICAgICB4bGFiID0gImIpIFBvd2VyLVNoYXJpbmcgXG4oTnVtYmVyIG9mIHJlYmVsIHNlYXRzKSIsDQojICAgICAgICAgICAgICAgICAgICAgICAgICAgICBjb25mID0gLjkwKQ0KIyBpbnRlcmFjdGlvbl9wbG90X2JpbmFyeShtb2RlbF9haWRwc19zcGVuZGluZ19jYWJJTkMsDQojICAgICAgICAgICAgICAgICAgICAgICAgICJhaWRkYXRhX0FpZEdEUF9sbiIsDQojICAgICAgICAgICAgICAgICAgICAgICAgICJjYWJpbmV0SU5DIiwgDQojICAgICAgICAgICAgICAgICAgICAgICAgICJjYWJpbmV0SU5DICogYWlkZGF0YV9BaWRHRFBfbG4iLCANCiMgICAgICAgICAgICAgICAgICAgICAgICAgdGl0bGUgPSAiIiwgDQojICAgICAgICAgICAgICAgICAgICAgICAgIHlsYWIgPSAiTWFyZ2luYWwgZWZmZWN0IG9mIEFpZFxuIG9uIFB1YmxpYyB2cy4gUGFydGljdWxhcmlzdGljIFNwZW5kaW5nIiwNCiMgICAgICAgICAgICAgICAgICAgICAgICAgeGxhYiA9ICJjKSBQb3dlci1TaGFyaW5nIFxuKDEgPSBZZXMsIDAgPSBObykiLA0KIyAgICAgICAgICAgICAgICAgICAgICAgICBjb25mID0gLjkwKQ0KIyANCiMgZGV2Lm9mZigpDQoNCiMgT3V0cHV0IGZvciBSZXBsaWNhdGlvbiBBcmNoaXZlDQoNCg0KcGFyKG1mcm93PWMoMSwzKSwNCiAgICBtYXIgPSBjKDUsIDcsIDQsIDAuNSksDQogICAgY2V4LmxhYiA9IDEuMywNCiAgICBjZXguYXhpcyA9IDEuMywNCiAgICBtZ3AgPSBjKDMuNSwgMSwgMCkpDQoNCg0KaW50ZXJhY3Rpb25fcGxvdF9jb250aW51b3VzKG1vZGVsX2FpZHBzX3NwZW5kaW5nLCANCiAgICAgICAgICAgICAgICAgICAgICAgICAgICAiY2FiaW5ldENPVU5UIiwgDQogICAgICAgICAgICAgICAgICAgICAgICAgICAgImFpZGRhdGFfQWlkR0RQX2xuIiwgDQogICAgICAgICAgICAgICAgICAgICAgICAgICAgImNhYmluZXRDT1VOVCAqIGFpZGRhdGFfQWlkR0RQX2xuIiwgDQogICAgICAgICAgICAgICAgICAgICAgICAgICAgdGl0bGUgPSAiIiwgDQogICAgICAgICAgICAgICAgICAgICAgICAgICAgeWxhYiA9ICJNYXJnaW5hbCBlZmZlY3Qgb2YgUG93ZXItU2hhcmluZyAoY2FiaW5ldCkgXG4gb24gUHVibGljIHZzLiBQYXJ0aWN1bGFyaXN0aWMgU3BlbmRpbmciLCANCiAgICAgICAgICAgICAgICAgICAgICAgICAgICBhZGRfbWVkaWFuX2VmZmVjdCA9IFQsDQogICAgICAgICAgICAgICAgICAgICAgICAgICAgeGxhYiA9ICJhKSBBaWQgLyBHRFAgKExvZylcbiIsIA0KICAgICAgICAgICAgICAgICAgICAgICAgICAgIGNvbmYgPSAuOTApDQppbnRlcmFjdGlvbl9wbG90X2NvbnRpbnVvdXMobW9kZWxfYWlkcHNfc3BlbmRpbmcsIA0KICAgICAgICAgICAgICAgICAgICAgICAgICAgICJhaWRkYXRhX0FpZEdEUF9sbiIsIA0KICAgICAgICAgICAgICAgICAgICAgICAgICAgICJjYWJpbmV0Q09VTlQiLCANCiAgICAgICAgICAgICAgICAgICAgICAgICAgICAiY2FiaW5ldENPVU5UICogYWlkZGF0YV9BaWRHRFBfbG4iLCANCiAgICAgICAgICAgICAgICAgICAgICAgICAgICB0aXRsZSA9ICIiLCANCiAgICAgICAgICAgICAgICAgICAgICAgICAgICBhZGRfbWVkaWFuX2VmZmVjdCA9IFQsDQogICAgICAgICAgICAgICAgICAgICAgICAgICAgeWxhYiA9ICJNYXJnaW5hbCBlZmZlY3Qgb2YgQWlkXG4gb24gUHVibGljIHZzLiBQYXJ0aWN1bGFyaXN0aWMgU3BlbmRpbmciLA0KICAgICAgICAgICAgICAgICAgICAgICAgICAgIHhsYWIgPSAiYikgUG93ZXItU2hhcmluZyBcbihOdW1iZXIgb2YgcmViZWwgc2VhdHMpIiwNCiAgICAgICAgICAgICAgICAgICAgICAgICAgICBjb25mID0gLjkwKQ0KaW50ZXJhY3Rpb25fcGxvdF9iaW5hcnkobW9kZWxfYWlkcHNfc3BlbmRpbmdfY2FiSU5DLA0KICAgICAgICAgICAgICAgICAgICAgICAgImFpZGRhdGFfQWlkR0RQX2xuIiwNCiAgICAgICAgICAgICAgICAgICAgICAgICJjYWJpbmV0SU5DIiwgDQogICAgICAgICAgICAgICAgICAgICAgICAiY2FiaW5ldElOQyAqIGFpZGRhdGFfQWlkR0RQX2xuIiwgDQogICAgICAgICAgICAgICAgICAgICAgICB0aXRsZSA9ICIiLCANCiAgICAgICAgICAgICAgICAgICAgICAgIHlsYWIgPSAiTWFyZ2luYWwgZWZmZWN0IG9mIEFpZFxuIG9uIFB1YmxpYyB2cy4gUGFydGljdWxhcmlzdGljIFNwZW5kaW5nIiwNCiAgICAgICAgICAgICAgICAgICAgICAgIHhsYWIgPSAiYykgUG93ZXItU2hhcmluZyBcbigxID0gWWVzLCAwID0gTm8pIiwNCiAgICAgICAgICAgICAgICAgICAgICAgIGNvbmYgPSAuOTApDQpgYGANCg0KDQoNCiMgRmlndXJlIDguNTogUHJvYmluZyBNZWNoYW5pc21zOiBWYXJpYXRpb24gaW4gVHlwZXMgb2YgUG93ZXItU2hhcmluZyBhbmQgQWlkDQpgYGB7ciwgZmlnLmFsaWduID0gImNlbnRlciIsIG1lc3NhZ2U9Riwgd2FybmluZz1GLCBjYWNoZSA9IFQsIGNvbW1lbnRzID0gRiwgZmlnLmhlaWdodCA9IDMuNX0NCg0KIyBMaWJyYXJpZXMNCmxpYnJhcnkodGlkeXZlcnNlKQ0KbGlicmFyeShjb3dwbG90KQ0KbGlicmFyeShsZmUpDQpsaWJyYXJ5KHRpa3pEZXZpY2UpDQoNCg0KIyBEYXRhDQpsb2FkKCIuL2RhdGEvZGlzc19kZi5yZGEiKQ0KDQpkaXNzX2RmIDwtIGRpc3NfZGYgJT4lIA0KICBkcGx5cjo6c2VsZWN0KC1tYXRjaGVzKCJsb2dpdCIpKSAlPiUgDQogIG11dGF0ZShkZ2FfZ2RwX2xuID0gbG9nKGRnYV9nZHBfemVybyArMSApLCANCiAgICAgICAgIHBnYV9nZHBfbG4gPSBsb2cocHJvZ3JhbV9haWRfZ2RwX3plcm8gKyAxKSwgDQogICAgICAgICBiZ2FfZ2RwX2xuID0gbG9nKGNvbW1vZGl0eV9haWRfZ2RwX3plcm8gKyAxKSkNCg0KIyBQcmVwYXJlIGRhdGEgZnJhbWUgZm9yIG11bHRpcGxlIHBsb3RzDQpzcGVuZGluZ192YXJzIDwtIGxpc3QoDQogIGNhYmluZXRDT1VOVCA9IGRpc3NfZGYsDQogIHNlbmlvckNPVU5UID0gZGlzc19kZiwgDQogIG5vbnNlbmlvckNPVU5UID0gZGlzc19kZiwgDQogIGRnYV9nZHBfbG4gPSBkaXNzX2RmLCANCiAgcGdhX2dkcF9sbiA9IGRpc3NfZGYsIA0KICBiZ2FfZ2RwX2xuID0gZGlzc19kZg0KKQ0KDQojIGNyZWF0ZSBkYXRhIGZyYW1lIHdpdGggbGlzdCBjb2x1bW4NCnNwZW5kaW5nX3ZhcnMgPC0gZW5mcmFtZShzcGVuZGluZ192YXJzKQ0KDQoNCiMgZGVmaW5lIGZ1bmN0aW9uIHRoYXQgd2lsbCBiZSBhcHBsaWVkIHRvIGV2ZXJ5IGRhdGEgZnJhbWUgaW4gdGhlIGxpc3QgY29sdW1uDQptYWluX21vZGVsIDwtIGZ1bmN0aW9uKGluZF92YXIsIGRhdGEpIHsNCiAgZGF0YSA8LSBhcy5kYXRhLmZyYW1lKGRhdGEpDQogIGRhdGEkaW5kX3ZhciA8LSBkYXRhWywgaW5kX3Zhcl0NCg0KICBpZihncmVwbCgiQ09VTlQiLCBpbmRfdmFyKSkgew0KICAgIG1vZGVsIDwtIGxmZTo6ZmVsbSh2MmRsZW5jbXBzX3QxIH4NCiAgICAgICAgICAgICAgICAgICAgICAgaW5kX3ZhciAqDQogICAgICAgICAgICAgICAgICAgICAgIGFpZGRhdGFfQWlkR0RQX2xuICsNCiAgICAgICAgICAgICAgICAgICAgICAgbG9nKEdEUF9wZXJfY2FwaXRhKSArDQogICAgICAgICAgICAgICAgICAgICAgIGxuX3BvcCArDQogICAgICAgICAgICAgICAgICAgICAgIGNvbmZfaW50ZW5zICsNCiAgICAgICAgICAgICAgICAgICAgICAgbm9uc3RhdGUgKw0KICAgICAgICAgICAgICAgICAgICAgICBXQm5hdHJlcyArDQogICAgICAgICAgICAgICAgICAgICAgIGZoIHwgMCB8IDAgfCBHV05vLA0KICAgICAgICAgICAgICAgICAgICAgZGF0YT1kYXRhKQ0KICAgIHJldHVybihtb2RlbCkNCg0KICB9IGVsc2Ugew0KICAgIG1vZGVsIDwtIGxmZTo6ZmVsbSh2MmRsZW5jbXBzX3QxIH4NCiAgICAgICAgICAgICAgICAgICAgICAgY2FiaW5ldENPVU5UICoNCiAgICAgICAgICAgICAgICAgICAgICAgaW5kX3ZhciArDQogICAgICAgICAgICAgICAgICAgICAgIGxvZyhHRFBfcGVyX2NhcGl0YSkgKw0KICAgICAgICAgICAgICAgICAgICAgICBsbl9wb3AgKw0KICAgICAgICAgICAgICAgICAgICAgICBjb25mX2ludGVucyArDQogICAgICAgICAgICAgICAgICAgICAgIG5vbnN0YXRlICsNCiAgICAgICAgICAgICAgICAgICAgICAgV0JuYXRyZXMgKw0KICAgICAgICAgICAgICAgICAgICAgICBmaCB8IDAgfCAwIHwgR1dObywNCiAgICAgICAgICAgICAgICAgICAgIGRhdGE9ZGF0YSkNCiAgcmV0dXJuKG1vZGVsKQ0KICB9DQogIA0KDQp9DQoNCg0KIyBmaXQgbW9kZWxzICYgcG9zdC1wcm9jZXNzIGRhdGEgZm9yIHBsb3R0aW5nDQptb2RlbF9hbGwgPC0gc3BlbmRpbmdfdmFycyAlPiUgDQogIGRwbHlyOjptdXRhdGUobW9kZWwgPSBtYXAyKG5hbWUsIHZhbHVlLCB+IG1haW5fbW9kZWwoLngsIC55KSkpIA0KDQptb2RlbF9vdXQgPC0gbW9kZWxfYWxsICU+JSANCiAgbXV0YXRlKGNvZWYgPSBtYXAobW9kZWwsIGJyb29tOjp0aWR5KSkgJT4lIA0KICB1bm5lc3QoY29lZikgJT4lIA0KICAjIGtlZXAgb25seSBpbnRlcmFjdGlvbiB0ZXJtIGNvZWZzDQogIGZpbHRlcihncmVwbCgiOiIsIHRlcm0pKSAlPiUgDQogIGRwbHlyOjpzZWxlY3QobmFtZSwgZXN0aW1hdGUsIHN0ZC5lcnJvcikgJT4lIA0KICBtdXRhdGUobmFtZSA9IGZvcmNhdHM6OmZjdF9yZWxldmVsKG5hbWUsIA0KICAgICAgICAgICAgICAgICAgICAgICAgICAgICAgICAgICAgIGMoImNhYmluZXRDT1VOVCIsIA0KICAgICAgICAgICAgICAgICAgICAgICAgICAgICAgICAgICAgICAgInNlbmlvckNPVU5UIiwgDQogICAgICAgICAgICAgICAgICAgICAgICAgICAgICAgICAgICAgICAibm9uc2VuaW9yQ09VTlQiLCANCiAgICAgICAgICAgICAgICAgICAgICAgICAgICAgICAgICAgICAgICJkZ2FfZ2RwX2xuIiwgDQogICAgICAgICAgICAgICAgICAgICAgICAgICAgICAgICAgICAgICAicGdhX2dkcF9sbiIsIA0KICAgICAgICAgICAgICAgICAgICAgICAgICAgICAgICAgICAgICAgImJnYV9nZHBfbG4iKSkpDQoNCm1vZGVsX291dF9wdWJnb29kcyA8LSBtb2RlbF9vdXQNCnNhdmUobW9kZWxfb3V0X3B1Ymdvb2RzLCBmaWxlPSAiLi9kYXRhL21lY2hhbmlzbV9tb2RlbHNfcHViZ29vZHMucmRhIikNCg0KDQptZWNoYW5pc21zX3NwZW5kaW5nX3Bsb3QgPC0gZ2dwbG90KG1vZGVsX291dCwgDQogICAgICAgYWVzKHggPSBuYW1lLCANCiAgICAgICAgICAgeSA9IGVzdGltYXRlKSkgKw0KICBnZW9tX3BvaW50KCBzaXplID0gMS43LCANCiAgICAgICBwb3NpdGlvbiA9IHBvc2l0aW9uX2RvZGdlKHdpZHRoID0gLjUpKSArIA0KICBnZW9tX2Vycm9yYmFyKGFlcyh5bWluID0gZXN0aW1hdGUgLSAxLjY3ICogc3RkLmVycm9yLCANCiAgICAgICAgICAgICAgICAgICAgeW1heCA9IGVzdGltYXRlICsgMS42NyAqIHN0ZC5lcnJvciksIA0KICAgICAgICAgICAgICAgIHdpZHRoID0gMCwNCiAgICAgICBwb3NpdGlvbiA9IHBvc2l0aW9uX2RvZGdlKHdpZHRoID0gLjUpKSArDQogDQogIGdlb21faGxpbmUoeWludGVyY2VwdCA9IDAsIGxpbmV0eXBlID0gMikgKw0KICB0aGVtZV9idygpKyANCiAgc2NhbGVfeF9kaXNjcmV0ZShsYWJlbHMgPSBjKCJDYWJpbmV0IFBTIChCYXNlbGluZSkiLCANCiAgICAgICAgICAgICAgICAgICAgICAgICAgICAgICAgICAgICAgIlNlbmlvciBQUyIsIA0KICAgICAgICAgICAgICAgICAgICAgICAgICAgICAgICAgICAgICAiTm9uc2VuaW9yIFBTIiwgDQogICAgICAgICAgICAgICAgICAgICAgICAgICAgICAgICAgICAgICJER0EiLCANCiAgICAgICAgICAgICAgICAgICAgICAgICAgICAgICAgICAgICAgIlByb2dyYW0gQWlkIiwgDQogICAgICAgICAgICAgICAgICAgICAgICAgICAgICAgICAgICAgICJCdWRnZXQgQWlkIikpICsNCiAgbGFicyh4ID0gIiIsIHkgPSAiRXN0aW1hdGUgb2YgSW50ZXJhY3Rpb24gQ29lZmZpY2llbnQgXG4gYmV0d2VlbiBEaWZmZXJlbnQgVHlwZXMgb2YgXG4gUG93ZXItU2hhcmluZyAoY2FiaW5ldCkgYW5kIEFpZCIpIA0KDQoNCg0KIyBPdXRwdXQgZm9yIG1hbnVzY3JpcHQNCiMgb3B0aW9ucyh0aWt6RG9jdW1lbnREZWNsYXJhdGlvbiA9ICJcXGRvY3VtZW50Y2xhc3NbMTFwdF17YXJ0aWNsZX0iICkNCiMgdGlreigiLi4vZmlndXJlcy9tZWNoYW5pc21zX3NwZW5kaW5nX3Bsb3QudGV4IiwgaGVpZ2h0ID0gMi43NSkNCiMgcHJpbnQobWVjaGFuaXNtc19zcGVuZGluZ19wbG90KQ0KIyBkZXYub2ZmKCkNCg0KIyBPdXRwdXQgZm9yIHJlcGxpY2F0aW9uIGFyY2hpdmUNCnByaW50KG1lY2hhbmlzbXNfc3BlbmRpbmdfcGxvdCkNCg0KYGBgDQoNCiMgRmlndXJlIDguNjogTW9kZWwgUHJlZGljdGlvbnMgZm9yIHRoZSBFZmZlY3Qgb2YgUG93ZXItU2hhcmluZyBhbmQgQnVkZ2V0IEFpZCBvbiBQb3N0LUNvbmZsaWN0IFB1YmxpYyBHb29kcyBQcm92aXNpb24NCg0KYGBge3IsIGZpZy5hbGlnbiA9ICJjZW50ZXIiLCBtZXNzYWdlPUYsIHdhcm5pbmc9RiwgY2FjaGUgPSBULCBjb21tZW50cyA9IEYsIGZpZy53aWR0aCA9IDYuNSwgZmlnLmhlaWdodCA9IDQuNSwgZGV2ID0gIkNhaXJvUE5HIn0NCg0KIyBMaWJyYXJpZXMNCmxpYnJhcnkodGlkeXZlcnNlKQ0KbGlicmFyeShybXMpDQpsaWJyYXJ5KGdyaWRFeHRyYSkNCmxpYnJhcnkodGlrekRldmljZSkNCg0KIyBMb2FkIGRhdGENCmxvYWQoImRhdGEvZGlzc19kZi5yZGEiKQ0KDQpkaXNzX2RmIDwtIGRpc3NfZGYgJT4lIA0KICBkcGx5cjo6c2VsZWN0KC1tYXRjaGVzKCJsb2dpdCIpKSAlPiUgDQogIG11dGF0ZShkZ2FfZ2RwX2xuID0gbG9nKGRnYV9nZHBfemVybyArMSApLCANCiAgICAgICAgIHBnYV9nZHBfbG4gPSBsb2cocHJvZ3JhbV9haWRfZ2RwX3plcm8gKyAxKSwgDQogICAgICAgICBiZ2FfZ2RwX2xuID0gbG9nKGNvbW1vZGl0eV9haWRfZ2RwX3plcm8gKyAxKSkNCg0KIyB0byBwcmVkaWN0IHN1YnN0YW50aXZlIGVmZmVjdHMgZnJvbSB0aGlzIG1vZGVsLCB3ZSBuZWVkIHRvIGRlZmluZSBkYXRhIA0KIyBkaXN0cmlidXRpb24NCmRpc3NfZGYkY29uZmxpY3RJRCA8LSBOVUxMDQpkYXRhZGlzdF9kaXNzX2RmIDwtIGRhdGFkaXN0KGRpc3NfZGYpOyBvcHRpb25zKGRhdGFkaXN0PSdkYXRhZGlzdF9kaXNzX2RmJykNCg0KIyByZXBsaWNhdGUgTW9kZWwgZnJvbSBhYm92ZSB3aXRoIHNwZW5kaW5nICsgY2FiQ09VTlQNCg0KbW9kZWxfYWlkcHNfc3BlbmRpbmcgPC0gb2xzKHYyZGxlbmNtcHNfdDEgfg0KICAgICAgICAgICAgICAgICAgICAgICAgICAgICAgY2FiaW5ldENPVU5UICogIA0KICAgICAgICAgICAgICAgICAgICAgICAgICAgICBiZ2FfZ2RwX2xuICsNCiAgICAgICAgICAgICAgICAgICAgICAgICAgICAgIGFpZGRhdGFfQWlkR0RQX2xuICsNCiAgICAgICAgICAgICAgICAgICAgICAgICAgICAgIGxuX2dkcF9wYyArDQogICAgICAgICAgICAgICAgICAgICAgICAgICAgICBsbl9wb3AgKw0KICAgICAgICAgICAgICAgICAgICAgICAgICAgICAgY29uZl9pbnRlbnMgKw0KICAgICAgICAgICAgICAgICAgICAgICAgICAgICAgbm9uc3RhdGUgKw0KICAgICAgICAgICAgICAgICAgICAgICAgICAgICAgV0JuYXRyZXMgKyANCiAgICAgICAgICAgICAgICAgICAgICAgICAgICAgIGZoLA0KICAgICAgICAgICAgICAgICAgICAgICAgICAgIGRhdGE9ZGlzc19kZiwgeD1ULCB5PVQpDQptb2RlbF9haWRwc19zcGVuZGluZyA8LSBybXM6OnJvYmNvdihtb2RlbF9haWRwc19zcGVuZGluZywgZGlzc19kZiRHV05vKQ0KDQojIFN0YXJ0IHByZWRpY3Rpb25zIGZvciBhaWQNCnByZWRpY3Rpb25fZGVtb2NfYWlkIDwtIFByZWRpY3QobW9kZWxfYWlkcHNfc3BlbmRpbmcsDQogICAgICAgICAgICAgICAgICAgICAgICAgICBjYWJpbmV0Q09VTlQgPSBjKDAsIDEwKSwgIyBubyAvIG11Y2ggcG93ZXItc2hhcmluZw0KICAgICAgICAgICAgICAgICAgICAgICAgICAgYmdhX2dkcF9sbiA9IHNlcSgtOCwgNC45LCAwLjEpLCMgcmFuZ2Ugb2YgYWlkDQogICAgICAgICAgICAgICAgICAgICAgICAgICBjb25mLmludCA9IDAuOSkgDQoNCnN1YnNfZWZmZWN0c19zcGVuZGluZ19haWQgPC0gZ2dwbG90KGRhdGEuZnJhbWUocHJlZGljdGlvbl9kZW1vY19haWQpLCANCiAgICAgICAgICAgICAgICAgICAgICAgICAgICAgICAgICAgIGFlcyh4ID0gZXhwKGJnYV9nZHBfbG4pLCANCiAgICAgICAgICAgICAgICAgICAgICAgICAgICAgICAgICAgICAgICB5ID0geWhhdCwgDQogICAgICAgICAgICAgICAgICAgICAgICAgICAgICAgICAgICAgICAgZ3JvdXAgPSBhcy5mYWN0b3IoY2FiaW5ldENPVU5UKSkpICsgDQogIGdlb21fbGluZSggY29sb3IgPSAiYmxhY2siLCBzaXplID0gMSkgKyANCiAgZ2VvbV9yaWJib24oYWVzKHltYXggPSB1cHBlciwgDQogICAgICAgICAgICAgICAgICB5bWluID0gbG93ZXIsIA0KICAgICAgICAgICAgICAgICAgZmlsbCA9IGFzLmZhY3RvcihjYWJpbmV0Q09VTlQpKSwgDQogICAgICAgICAgICAgIGFscGhhID0gMC43KSArDQogIHNjYWxlX2ZpbGxfbWFudWFsKHZhbHVlcyA9IGMoIiNiM2NkZTMiLCAiI2U0MWExYyIpLCANCiAgICAgICAgICAgICAgICAgICAgbmFtZSA9ICJOdW1iZXIgb2YgUmViZWxzIFxuaW4gdGhlIFBvd2VyLVNoYXJpbmcgQ29hbGl0aW9uOiIpICsNCiAgdGhlbWVfYncoKSArDQogIHRoZW1lKHRleHQgPSBlbGVtZW50X3RleHQoc2l6ZT04KSkgKw0KICBsYWJzKHggPSAiQnVkZ2V0IEFpZCAvIEdEUCIsIA0KICAgICAgIHkgPSAiUHJlZGljdGVkIFB1YmxpYyB2cy4gXG5QYXJ0aWN1bGFyaXN0aWMgU3BlbmRpbmcgU2NvcmVzIikgKw0KICB0aGVtZShsZWdlbmQucG9zaXRpb24gPSAiYm90dG9tIikgDQoNCiMgUHJlZGljdGlvbnMgcG93ZXItc2hhcmluZw0KcHJlZGljdGlvbl9kZW1vY19wcyA8LSBQcmVkaWN0KG1vZGVsX2FpZHBzX3NwZW5kaW5nLCANCiAgICAgICAgICAgICAgICAgICAgICAgICAgICAgIGNhYmluZXRDT1VOVCA9IHNlcSgwLCAxMCwgMSksIA0KICAgICAgICAgICAgICAgICAgICAgICAgICAgICAgYmdhX2dkcF9sbiA9IGMoMCwgMy40KSwNCiAgICAgICAgICAgICAgICAgICAgICAgICAgICAgIGNvbmYuaW50ID0gMC45KQ0KDQpwcmVkaWN0aW9uX2RlbW9jX3BzJGJnYV9nZHBfbG4gPC0gcm91bmQoZXhwKHByZWRpY3Rpb25fZGVtb2NfcHMkYmdhX2dkcF9sbikpDQoNCg0Kc3Vic19lZmZlY3RzX3NwZW5kaW5nX3BzIDwtIGdncGxvdChkYXRhLmZyYW1lKHByZWRpY3Rpb25fZGVtb2NfcHMpLCANCiAgICAgICAgICAgICAgICAgICAgICAgICAgICAgICAgICAgICAgICAgICBhZXMoeCA9IGNhYmluZXRDT1VOVCwgDQogICAgICAgICAgICAgICAgICAgICAgICAgICAgICAgICAgICAgICAgICAgICAgIHkgPSB5aGF0LCANCiAgICAgICAgICAgICAgICAgICAgICAgICAgICAgICAgICAgICAgICAgICAgICAgZ3JvdXAgPSBhcy5mYWN0b3IoZXhwKGJnYV9nZHBfbG4pKSkpICsgDQogIGdlb21fbGluZSggY29sb3IgPSAiYmxhY2siLCBzaXplID0gMSkgKyANCiAgZ2VvbV9yaWJib24oYWVzKHltYXggPSB1cHBlciwgDQogICAgICAgICAgICAgICAgICB5bWluID0gbG93ZXIsIA0KICAgICAgICAgICAgICAgICAgZmlsbCA9IGFzLmZhY3RvcihiZ2FfZ2RwX2xuKSksIA0KICAgICAgICAgICAgICBhbHBoYSA9IDAuNykgKw0KICBzY2FsZV9maWxsX21hbnVhbCh2YWx1ZXMgPSBjKCIjYjNjZGUzIiwgIiNlNDFhMWMiKSwgDQogICAgICAgICAgICAgICAgICAgIG5hbWUgPSAiQnVkZ2V0IEFpZCBpbiBwZXIgY2VudCBvZiBHRFA6IikgKw0KICB0aGVtZV9idygpICsNCiAgc2NhbGVfeF9jb250aW51b3VzKGJyZWFrcyA9IHNlcSgwLCAxMCwgMikpICsNCiAgdGhlbWUodGV4dCA9IGVsZW1lbnRfdGV4dChzaXplPTgpKSArDQogIGxhYnMoeCA9ICJQb3dlci1TaGFyaW5nIChOby4gb2YgcmViZWwgc2VhdHMgaW4gZ292ZXJubWVudCkiLCANCiAgICAgICB5ID0gIlByZWRpY3RlZCBQdWJsaWMgdnMuIFxuUGFydGljdWxhcmlzdGljIFNwZW5kaW5nIFNjb3JlcyIpICsNCiAgdGhlbWUobGVnZW5kLnBvc2l0aW9uID0gImJvdHRvbSIpIA0KDQojIG91dHB1dCBwcmVkaWN0aW9uIHBsb3RzDQoNCg0KIyBvdXRwdXQgcGxvdCBmb3IgcHJlZGljdGVkIFZERU0gZWxlY3Rpb24gcXVhbGl0eSB2YXJpYWJsZXMgDQoNCiANCiMgb3B0aW9ucyggdGlrekRvY3VtZW50RGVjbGFyYXRpb24gPSAiXFxkb2N1bWVudGNsYXNzWzExcHRde2FydGljbGV9IiApDQojIHRpa3ooIi4uL2ZpZ3VyZXMvYnVkZ2V0X2FpZHBzX3NwZW5kaW5nLnRleCIsIGhlaWdodCA9IDQuNSwgd2lkdGggPSA2LjUpDQojIGdyaWQuYXJyYW5nZShzdWJzX2VmZmVjdHNfc3BlbmRpbmdfcHMsDQojICAgICAgICAgICAgICBzdWJzX2VmZmVjdHNfc3BlbmRpbmdfYWlkLA0KIyAgICAgICAgICAgICAgbnJvdyA9IDEpDQojIGRldi5vZmYoKQ0KDQpncmlkLmFycmFuZ2Uoc3Vic19lZmZlY3RzX3NwZW5kaW5nX3BzLCANCiAgICAgICAgICAgICBzdWJzX2VmZmVjdHNfc3BlbmRpbmdfYWlkLCANCiAgICAgICAgICAgICBucm93ID0gMSkNCg0KYGBgDQoNCg0KDQoNCiMgVGFibGUgOC4xOiBQb3dlci1TaGFyaW5nLCBGb3JlaWduIEFpZCwgYW5kIFBvc3QtQ29uZmxpY3QgUHJvdmlzaW9uIG9mIFB1YmxpYyBHb29kczogSW5kaXZpZHVhbCBFZmZlY3RzDQoNCmBgYHtyLCByZXN1bHRzPSJhc2lzIiwgbWVzc2FnZT1GLCB3YXJuaW5nPUYsIGNhY2hlID0gVCwgY29tbWVudHMgPSBGfQ0KDQojIExpYnJhcmllcw0KbGlicmFyeSh0ZXhyZWcpDQpzb3VyY2UoImZ1bmN0aW9ucy9leHRyYWN0X29sc19jdXN0b20uUiIpDQpsaWJyYXJ5KHJtcykNCg0KDQojIGxvYWQgRGF0YQ0KbG9hZCgiLi9kYXRhL2Rpc3NfZGYucmRhIikNCg0KDQojIFBvd2VyLVNoYXJpbmcgTW9kZWxzDQptb2RlbF9wc19zcGVuZGluZ19jYWJjb3VudCA8LSBvbHModjJkbGVuY21wc190MSB+DQogICAgICAgICAgICAgICAgICAgICAgICAgICAgICAgICAgICAgY2FiaW5ldENPVU5UICsgIA0KICAgICAgICAgICAgICAgICAgICAgICAgICAgICAgICAgICAgIGFpZGRhdGFfQWlkR0RQX2xuICsNCiAgICAgICAgICAgICAgICAgICAgICAgICAgICAgICAgICAgICBsbl9nZHBfcGMgKw0KICAgICAgICAgICAgICAgICAgICAgICAgICAgICAgICAgICAgIGxuX3BvcCArDQogICAgICAgICAgICAgICAgICAgICAgICAgICAgICAgICAgICAgY29uZl9pbnRlbnMgKw0KICAgICAgICAgICAgICAgICAgICAgICAgICAgICAgICAgICAgIG5vbnN0YXRlICsNCiAgICAgICAgICAgICAgICAgICAgICAgICAgICAgICAgICAgICBXQm5hdHJlcyArIA0KICAgICAgICAgICAgICAgICAgICAgICAgICAgICAgICAgICAgIGZoLA0KICAgICAgICAgICAgICAgICAgICAgICAgICAgICAgICAgICBkYXRhPWRpc3NfZGYsIHg9VCwgeT1UKQ0KbW9kZWxfcHNfc3BlbmRpbmdfY2FiY291bnQgPC0gcm1zOjpyb2Jjb3YobW9kZWxfcHNfc3BlbmRpbmdfY2FiY291bnQsIGRpc3NfZGYkR1dObykNCg0KDQptb2RlbF9wc19zcGVuZGluZ19zZW5pb3Jjb3VudCA8LSBvbHModjJkbGVuY21wc190MSB+DQogICAgICAgICAgICAgICAgICAgICAgICAgICAgICBzZW5pb3JDT1VOVCAgKyANCiAgICAgICAgICAgICAgICAgICAgICAgICAgICAgIGFpZGRhdGFfQWlkR0RQX2xuICsNCiAgICAgICAgICAgICAgICAgICAgICAgICAgICAgIGxuX2dkcF9wYyArDQogICAgICAgICAgICAgICAgICAgICAgICAgICAgICBsbl9wb3AgKw0KICAgICAgICAgICAgICAgICAgICAgICAgICAgICAgY29uZl9pbnRlbnMgKw0KICAgICAgICAgICAgICAgICAgICAgICAgICAgICAgbm9uc3RhdGUgKw0KICAgICAgICAgICAgICAgICAgICAgICAgICAgICAgV0JuYXRyZXMgKyANCiAgICAgICAgICAgICAgICAgICAgICAgICAgICAgIGZoLA0KICAgICAgICAgICAgICAgICAgICAgICAgICAgIGRhdGE9ZGlzc19kZiwgeD1ULCB5PVQpDQptb2RlbF9wc19zcGVuZGluZ19zZW5pb3Jjb3VudCA8LSBybXM6OnJvYmNvdihtb2RlbF9wc19zcGVuZGluZ19zZW5pb3Jjb3VudCwgZGlzc19kZiRHV05vKQ0KDQoNCm1vZGVsX3BzX3NwZW5kaW5nX25vbnNlbmlvcmNvdW50IDwtIG9scyh2MmRsZW5jbXBzX3QxIH4NCiAgICAgICAgICAgICAgICAgICAgICAgICAgICAgIG5vbnNlbmlvckNPVU5UICsgIA0KICAgICAgICAgICAgICAgICAgICAgICAgICAgICAgYWlkZGF0YV9BaWRHRFBfbG4gKw0KICAgICAgICAgICAgICAgICAgICAgICAgICAgICAgbG5fZ2RwX3BjICsNCiAgICAgICAgICAgICAgICAgICAgICAgICAgICAgIGxuX3BvcCArDQogICAgICAgICAgICAgICAgICAgICAgICAgICAgICBjb25mX2ludGVucyArDQogICAgICAgICAgICAgICAgICAgICAgICAgICAgICBub25zdGF0ZSArDQogICAgICAgICAgICAgICAgICAgICAgICAgICAgICBXQm5hdHJlcyArIA0KICAgICAgICAgICAgICAgICAgICAgICAgICAgICAgZmgsDQogICAgICAgICAgICAgICAgICAgICAgICAgICAgZGF0YT1kaXNzX2RmLCB4PVQsIHk9VCkNCm1vZGVsX3BzX3NwZW5kaW5nX25vbnNlbmlvcmNvdW50IDwtIHJtczo6cm9iY292KG1vZGVsX3BzX3NwZW5kaW5nX25vbnNlbmlvcmNvdW50LCBkaXNzX2RmJEdXTm8pDQoNCiMgQWlkIE1vZGVscw0KDQptb2RlbF9kZ2Ffc3BlbmRpbmcgPC0gb2xzKHYyZGxlbmNtcHNfdDEgfg0KICAgICAgICAgICAgICAgICAgICAgICAgICAgICAgY2FiaW5ldENPVU5UICsgDQogICAgICAgICAgICAgICAgICAgICAgICAgICAgbG9nKGRnYV9nZHBfemVybyArIDEpICsNCiAgICAgICAgICAgICAgICAgICAgICAgICAgICAgIGFpZGRhdGFfQWlkR0RQX2xuICsNCiAgICAgICAgICAgICAgICAgICAgICAgICAgICAgIGxuX2dkcF9wYyArDQogICAgICAgICAgICAgICAgICAgICAgICAgICAgICBsbl9wb3AgKw0KICAgICAgICAgICAgICAgICAgICAgICAgICAgICAgY29uZl9pbnRlbnMgKw0KICAgICAgICAgICAgICAgICAgICAgICAgICAgICAgbm9uc3RhdGUgKw0KICAgICAgICAgICAgICAgICAgICAgICAgICAgICAgV0JuYXRyZXMgKyANCiAgICAgICAgICAgICAgICAgICAgICAgICAgICAgIGZoLA0KICAgICAgICAgICAgICAgICAgICAgICAgICAgIGRhdGE9ZGlzc19kZiwgeD1ULCB5PVQpDQptb2RlbF9kZ2Ffc3BlbmRpbmcgPC0gcm1zOjpyb2Jjb3YobW9kZWxfZGdhX3NwZW5kaW5nLCBkaXNzX2RmJEdXTm8pDQoNCm1vZGVsX3BnYV9zcGVuZGluZyA8LSBvbHModjJkbGVuY21wc190MSB+DQogICAgICAgICAgICAgICAgICAgICAgICAgICAgICBjYWJpbmV0Q09VTlQgKyANCiAgICAgICAgICAgICAgICAgICAgICAgICAgICBsb2cocHJvZ3JhbV9haWRfZ2RwX3plcm8gKyAxKSArDQogICAgICAgICAgICAgICAgICAgICAgICAgICAgICBhaWRkYXRhX0FpZEdEUF9sbiArDQogICAgICAgICAgICAgICAgICAgICAgICAgICAgICBsbl9nZHBfcGMgKw0KICAgICAgICAgICAgICAgICAgICAgICAgICAgICAgbG5fcG9wICsNCiAgICAgICAgICAgICAgICAgICAgICAgICAgICAgIGNvbmZfaW50ZW5zICsNCiAgICAgICAgICAgICAgICAgICAgICAgICAgICAgIG5vbnN0YXRlICsNCiAgICAgICAgICAgICAgICAgICAgICAgICAgICAgIFdCbmF0cmVzICsgDQogICAgICAgICAgICAgICAgICAgICAgICAgICAgICBmaCwNCiAgICAgICAgICAgICAgICAgICAgICAgICAgICBkYXRhPWRpc3NfZGYsIHg9VCwgeT1UKQ0KbW9kZWxfcGdhX3NwZW5kaW5nIDwtIHJtczo6cm9iY292KG1vZGVsX3BnYV9zcGVuZGluZywgZGlzc19kZiRHV05vKQ0KDQptb2RlbF9iZ2Ffc3BlbmRpbmcgPC0gb2xzKHYyZGxlbmNtcHNfdDEgfg0KICAgICAgICAgICAgICAgICAgICAgICAgICAgICAgY2FiaW5ldENPVU5UICsgDQogICAgICAgICAgICAgICAgICAgICAgICAgICAgbG9nKGNvbW1vZGl0eV9haWRfZ2RwX3plcm8gKyAxKSArDQogICAgICAgICAgICAgICAgICAgICAgICAgICAgICBhaWRkYXRhX0FpZEdEUF9sbiArDQogICAgICAgICAgICAgICAgICAgICAgICAgICAgICBsbl9nZHBfcGMgKw0KICAgICAgICAgICAgICAgICAgICAgICAgICAgICAgbG5fcG9wICsNCiAgICAgICAgICAgICAgICAgICAgICAgICAgICAgIGNvbmZfaW50ZW5zICsNCiAgICAgICAgICAgICAgICAgICAgICAgICAgICAgIG5vbnN0YXRlICsNCiAgICAgICAgICAgICAgICAgICAgICAgICAgICAgIFdCbmF0cmVzICsgDQogICAgICAgICAgICAgICAgICAgICAgICAgICAgICBmaCwNCiAgICAgICAgICAgICAgICAgICAgICAgICAgICBkYXRhPWRpc3NfZGYsIHg9VCwgeT1UKQ0KbW9kZWxfYmdhX3NwZW5kaW5nIDwtIHJtczo6cm9iY292KG1vZGVsX2JnYV9zcGVuZGluZywgZGlzc19kZiRHV05vKQ0KDQoNCm1vZGVsX2xpc3QgPC0gbGlzdChtb2RlbF9wc19zcGVuZGluZ19jYWJjb3VudCwgDQogICAgICAgICAgICAgICAgICAgbW9kZWxfcHNfc3BlbmRpbmdfc2VuaW9yY291bnQsIA0KICAgICAgICAgICAgICAgICAgIG1vZGVsX3BzX3NwZW5kaW5nX25vbnNlbmlvcmNvdW50LA0KICAgICAgICAgICAgICAgICAgIG1vZGVsX2RnYV9zcGVuZGluZywgDQogICAgICAgICAgICAgICAgICAgbW9kZWxfcGdhX3NwZW5kaW5nLCANCiAgICAgICAgICAgICAgICAgICBtb2RlbF9iZ2Ffc3BlbmRpbmcpDQoNCmNvZWZfbmFtZV9tYXAgPC0gbGlzdCgNCiAgICAgICAgICAgICAgICAgICAgICBjYWJpbmV0SU5DID0gIlBvd2VyLVNoYXJpbmcgKGJpbmFyeSkiLA0KICAgICAgICAgICAgICAgICAgICAgICJjYWJpbmV0SU5DICogYWlkZGF0YV9BaWRHRFBfbG4iID0gIlBvd2VyLVNoYXJpbmcgKGJpbmFyeSkgKiBBaWQiLA0KICAgICAgICAgICAgICAgICAgICAgIGNhYmluZXRDT1VOVCA9ICJQb3dlci1TaGFyaW5nIChjYWJpbmV0KSIsDQogICAgICAgICAgICAgICAgICAgICAgICAgICAgICAgICAgICAgICAgICAgIHNlbmlvckNPVU5UID0gIlBvd2VyLVNoYXJpbmcgKHNlbmlvcikiLA0KICAgICAgICAgICAgICAgICAgICAgIG5vbnNlbmlvckNPVU5UID0gIlBvd2VyLVNoYXJpbmcgKG5vbnNlbmlvcikiLA0KDQogICAgICAgICAgICAgICAgICAgICAgImNhYmluZXRDT1VOVCAqIGFpZGRhdGFfQWlkR0RQX2xuIiA9ICJQb3dlci1TaGFyaW5nIChjYWJpbmV0KSAqIEFpZCIsIA0KICAgICAgICAgICAgICAgICAgICAgICJjYWJpbmV0Q09VTlQ6YWlkZGF0YV9BaWRHRFBfbG4iID0gIlBTIChjYWJpbmV0KSAqIEFpZCIsDQogICAgICAgICAgICAgICAgICAgICAgcHNfc2hhcmUgPSAiUFMgKGNhYmluZXQgc2hhcmUpIiwNCiAgICAgICAgICAgICAgICAgICAgICAicHNfc2hhcmUgKiBhaWRkYXRhX0FpZEdEUF9sbiIgPSAiUFMgKGNhYmluZXQgc2hhcmUpICogQWlkIiwNCiAgICAgICAgICAgICAgICAgICAgICBkZ2FfZ2RwX3plcm8gPSAiREdBL0dEUCAobG9nKSIsIA0KICAgICAgICAgICAgICAgICAgICAgIHByb2dyYW1fYWlkX2dkcF96ZXJvID0gIlByb2dyYW0gQWlkL0dEUCAobG9nKSIsIA0KICAgICAgICAgICAgICAgICAgICAgIGNvbW1vZGl0eV9haWRfZ2RwX3plcm8gPSAiQnVkZ2V0IEFpZC9HRFAgKGxvZykiLCANCiAgICAgICAgICAgICAgICAgICAgICBhaWRkYXRhX0FpZEdEUF9sbiA9ICJBaWQgLyBHRFAgKGxvZykiLA0KICAgICAgICAgICAgICAgICAgICAgIA0KICAgICAgICAgICAgICAgICAgICAgIGxuX2dkcF9wYyA9ICJHRFAgcC9jIChsb2cpIiwNCiAgICAgICAgICAgICAgICAgICAgICBsbl9wb3AgPSAiUG9wdWxhdGlvbiAobG9nKSIsDQogICAgICAgICAgICAgICAgICAgICAgY29uZl9pbnRlbnMgPSAiQ29uZmxpY3QgSW50ZW5zaXR5IiwNCiAgICAgICAgICAgICAgICAgICAgICBub25zdGF0ZSA9ICJOb24tU3RhdGUgVmlvbGVuY2UiLA0KICAgICAgICAgICAgICAgICAgICAgIFdCbmF0cmVzID0gIk5hdC4gUmVzLiBSZW50cyIsDQogICAgICAgICAgICAgICAgICAgICAgcG9saXR5MiA9ICJQb2xpdHkiLA0KICAgICAgICAgICAgICAgICAgICAgIGZoID0gIlJlZ2ltZSBUeXBlIChGSCkiLA0KICAgICAgICAgICAgICAgICAgICAgIEV0aG5pYyA9ICJFdGhuaWMgRnJhYy4iLA0KICAgICAgICAgICAgICAgICAgICAgIERTX29yZGluYWwgPSAiVU4gUEtPIikNCg0KIyBHZXQgbnVtYmVyIG9mIGNsdXN0ZXJzDQpzb3VyY2UoIi4vZnVuY3Rpb25zL2V4dHJhY3Rfb2xzX2N1c3RvbS5SIikNCg0KDQojIGN1c3RvbSBmdW5jdGlvbnMgdG8gd3JpdGUgdGV4IG91dHB1dA0Kc291cmNlKCIuL2Z1bmN0aW9ucy9jdXN0b21fdGV4cmVnLlIiKQ0KZW52aXJvbm1lbnQoY3VzdG9tX3RleHJlZykgPC0gYXNOYW1lc3BhY2UoJ3RleHJlZycpDQoNCiMgDQojICMgT3V0cHV0IE1hbnVzY3JpcHQNCiMgY3VzdG9tX3RleHJlZyhsID0gbW9kZWxfbGlzdCwNCiMgICAgICAgICAgIHN0YXJzID0gYygwLjAwMSwgMC4wMSwgMC4wNSwgMC4xKSwNCiMgICAgICAgICAgIGN1c3RvbS5jb2VmLm1hcCA9IGNvZWZfbmFtZV9tYXAsDQojICAgICAgICBmaWxlID0gIi4uL291dHB1dC9haWRfcHNfaW5kZWZmX3B1Ymdvb2RzLnRleCIsDQojICAgICAgICAgICBzeW1ib2wgPSAiKyIsDQojICAgICAgICAgICB0YWJsZSA9IEYsDQojICAgICAgICAgICBib29rdGFicyA9IFQsDQojICAgICAgICAgICB1c2UucGFja2FnZXMgPSBGLA0KIyAgICAgICAgICAgZGNvbHVtbiA9IFQsDQojICAgICAgICAgICBpbmNsdWRlLmxyID0gRiwNCiMgICAgICAgICAgIGluY2x1ZGUucnNxdWFyZWQgPSBGLA0KIyAgICAgICAgICAgICAgICAgIGluY2x1ZGUuY2x1c3RlciA9IFQsDQojIA0KIyAgICAgICAgICAgaW5jbHVkZS5hZGpycyA9IFQsDQojICAgICAgICAgY2FwdGlvbiA9ICIiKQ0KICAgICAgICAgICAgICAjIGN1c3RvbS5tdWx0aWNvbCA9IFQpIA0KICAgICAgICAgICAgICAjIGN1c3RvbS5tb2RlbC5uYW1lcyA9IGMoIiBcXG11bHRpY29sdW1uezN9e2N9eyBcXHRleHRiZntQb3dlci1TaGFyaW5nfX0gJiBcXG11bHRpY29sdW1uezN9e2N9eyBcXHRleHRiZntGb3JlaWduIEFpZH19IFxcXFwgXFxjbWlkcnVsZShyKXsyLTR9IFxcY21pZHJ1bGUobCl7NS03fSAmIFxcbXVsdGljb2x1bW57MX17Y317KDEpICB9IiwNCiAgICAgICAgICAgICAgIyAgICAgICAgICAgICAgICAgICAgICAgICJcXG11bHRpY29sdW1uezF9e2N9eygyKSAgfSIsDQogICAgICAgICAgICAgICMgICAgICAgICAgICAgICAgICAgICAgICAiXFxtdWx0aWNvbHVtbnsxfXtjfXsoMykgIH0iLA0KICAgICAgICAgICAgICAjICAgICAgICAgICAgICAgICAgICAgICAgIlxcbXVsdGljb2x1bW57MX17Y317KDQpICB9IiwNCiAgICAgICAgICAgICAgIyAgICAgICAgICAgICAgICAgICAgICAgICJcXG11bHRpY29sdW1uezF9e2N9eyg1KSAgIH0iLA0KICAgICAgICAgICAgICAjICAgICAgICAgICAgICAgICAgICAgICAgIlxcbXVsdGljb2x1bW57MX17Y317KDYpICAgfSIpKQ0KDQoNCiMgT3V0cHV0IFJlcGxpY2F0aW9uIEFyY2hpdmUNCmh0bWxyZWcobCA9IG1vZGVsX2xpc3QsIA0KICAgICAgICAgIHN0YXJzID0gYygwLjAwMSwgMC4wMSwgMC4wNSwgMC4xKSwNCiAgICAgICAgICBjdXN0b20uY29lZi5tYXAgPSBjb2VmX25hbWVfbWFwLA0KICAgICAgICAgIHN5bWJvbCA9ICIrIiwNCiAgICAgICAgICB0YWJsZSA9IEYsDQogICAgICAgICAgYm9va3RhYnMgPSBULA0KICAgICAgICAgIHVzZS5wYWNrYWdlcyA9IEYsDQogICAgICANCiAgICAgICAgICBkY29sdW1uID0gVCwNCiAgICAgICAgICBpbmNsdWRlLmxyID0gRiwNCiAgICAgICAgICBpbmNsdWRlLnJzcXVhcmVkID0gRiwNCiAgICAgICAgICBpbmNsdWRlLmFkanJzID0gVCwNCiAgICAgICAgICBpbmNsdWRlLmNsdXN0ZXIgPSBULA0KICAgICAgICBjYXB0aW9uID0gIiIsIA0KICAgICAgICBzdGFyLnN5bWJvbCA9ICJcXCoiKQ0KDQoNCg0KYGBgIA0KDQojIFRhYmxlIDguMjogVGhlIEludGVyYWN0aW9uIEVmZmVjdCBvZiBQb3dlci1TaGFyaW5nIGFuZCBGb3JlaWduIEFpZCBvbiBQb3N0LUNvbmZsaWN0IFByb3Zpc2lvbiBvZiBQdWJsaWMgR29vZHMNCg0KYGBge3IsIHJlc3VsdHM9ImFzaXMiLCBtZXNzYWdlPUYsIHdhcm5pbmc9RiwgY2FjaGUgPSBULCBjb21tZW50cyA9IEZ9DQoNCiMgTGlicmFyaWVzDQpsaWJyYXJ5KHRleHJlZykNCnNvdXJjZSgiZnVuY3Rpb25zL2V4dHJhY3Rfb2xzX2N1c3RvbS5SIikNCmxpYnJhcnkocm1zKQ0KDQoNCiMgbG9hZCBEYXRhDQpsb2FkKCIuL2RhdGEvZGlzc19kZi5yZGEiKQ0KDQoNCiMgYmluYXJ5IFBTDQptb2RlbF9haWRwc19zcGVuZGluZ19jYWJJTkMgPC0gb2xzKHYyZGxlbmNtcHNfdDEgfg0KICAgICAgICAgICAgICAgICAgICAgICAgICAgICAgICAgICAgIGNhYmluZXRJTkMgKiAgDQogICAgICAgICAgICAgICAgICAgICAgICAgICAgICAgICAgICAgYWlkZGF0YV9BaWRHRFBfbG4gKw0KICAgICAgICAgICAgICAgICAgICAgICAgICAgICAgICAgICAgIGxuX2dkcF9wYyArDQogICAgICAgICAgICAgICAgICAgICAgICAgICAgICAgICAgICAgbG5fcG9wICsNCiAgICAgICAgICAgICAgICAgICAgICAgICAgICAgICAgICAgICBjb25mX2ludGVucyArDQogICAgICAgICAgICAgICAgICAgICAgICAgICAgICAgICAgICAgbm9uc3RhdGUgKw0KICAgICAgICAgICAgICAgICAgICAgICAgICAgICAgICAgICAgIFdCbmF0cmVzICsgDQogICAgICAgICAgICAgICAgICAgICAgICAgICAgICAgICAgICAgZmgsDQogICAgICAgICAgICAgICAgICAgICAgICAgICAgICAgICAgIGRhdGE9ZGlzc19kZiwgeD1ULCB5PVQpDQptb2RlbF9haWRwc19zcGVuZGluZ19jYWJJTkMgPC0gcm1zOjpyb2Jjb3YobW9kZWxfYWlkcHNfc3BlbmRpbmdfY2FiSU5DLCBkaXNzX2RmJEdXTm8pDQoNCg0KbW9kZWxfYWlkcHNfc3BlbmRpbmcgPC0gb2xzKHYyZGxlbmNtcHNfdDEgfg0KICAgICAgICAgICAgICAgICAgICAgICAgICAgICAgY2FiaW5ldENPVU5UICogIA0KICAgICAgICAgICAgICAgICAgICAgICAgICAgICAgYWlkZGF0YV9BaWRHRFBfbG4gKw0KICAgICAgICAgICAgICAgICAgICAgICAgICAgICAgbG5fZ2RwX3BjICsNCiAgICAgICAgICAgICAgICAgICAgICAgICAgICAgIGxuX3BvcCArDQogICAgICAgICAgICAgICAgICAgICAgICAgICAgICBjb25mX2ludGVucyArDQogICAgICAgICAgICAgICAgICAgICAgICAgICAgICBub25zdGF0ZSArDQogICAgICAgICAgICAgICAgICAgICAgICAgICAgICBXQm5hdHJlcyArIA0KICAgICAgICAgICAgICAgICAgICAgICAgICAgICAgZmgsDQogICAgICAgICAgICAgICAgICAgICAgICAgICAgZGF0YT1kaXNzX2RmLCB4PVQsIHk9VCkNCm1vZGVsX2FpZHBzX3NwZW5kaW5nIDwtIHJtczo6cm9iY292KG1vZGVsX2FpZHBzX3NwZW5kaW5nLCBkaXNzX2RmJEdXTm8pDQoNCg0KDQptb2RlbF9haWRwc19jb3JyX2NhYmluYyA8LSBvbHModjJ4X2NvcnJfdDEgfg0KICAgICAgICAgICAgICAgICAgICAgICAgICAgICAgY2FiaW5ldElOQyAqICANCiAgICAgICAgICAgICAgICAgICAgICAgICAgICAgIGFpZGRhdGFfQWlkR0RQX2xuICsNCiAgICAgICAgICAgICAgICAgICAgICAgICAgICAgIGxuX2dkcF9wYyArDQogICAgICAgICAgICAgICAgICAgICAgICAgICAgICBsbl9wb3AgKw0KICAgICAgICAgICAgICAgICAgICAgICAgICAgICAgY29uZl9pbnRlbnMgKw0KICAgICAgICAgICAgICAgICAgICAgICAgICAgICAgbm9uc3RhdGUgKw0KICAgICAgICAgICAgICAgICAgICAgICAgICAgICAgbG9nKFdCbmF0cmVzICsgMSkgKw0KICAgICAgICAgICAgICAgICAgICAgICAgICAgICAgZmgsDQogICAgICAgICAgICAgICAgICAgICAgICAgICAgZGF0YT1kaXNzX2RmLCB4PVQsIHk9VCkNCm1vZGVsX2FpZHBzX2NvcnJfY2FiaW5jIDwtIHJtczo6cm9iY292KG1vZGVsX2FpZHBzX2NvcnJfY2FiaW5jLCBkaXNzX2RmJEdXTm8pDQoNCg0KDQptb2RlbF9haWRwc19jb3JyIDwtIG9scyh2MnhfY29ycl90MSB+DQogICAgICAgICAgICAgICAgICAgICAgICAgICAgICBjYWJpbmV0Q09VTlQgKiAgDQogICAgICAgICAgICAgICAgICAgICAgICAgICAgICBhaWRkYXRhX0FpZEdEUF9sbiArDQogICAgICAgICAgICAgICAgICAgICAgICAgICAgICBsbl9nZHBfcGMgKw0KICAgICAgICAgICAgICAgICAgICAgICAgICAgICAgbG5fcG9wICsNCiAgICAgICAgICAgICAgICAgICAgICAgICAgICAgIGNvbmZfaW50ZW5zICsNCiAgICAgICAgICAgICAgICAgICAgICAgICAgICAgIG5vbnN0YXRlICsNCiAgICAgICAgICAgICAgICAgICAgICAgICAgICAgIGxvZyhXQm5hdHJlcyArIDEpICsNCiAgICAgICAgICAgICAgICAgICAgICAgICAgICAgIGZoLA0KICAgICAgICAgICAgICAgICAgICAgICAgICAgIGRhdGE9ZGlzc19kZiwgeD1ULCB5PVQpDQptb2RlbF9haWRwc19jb3JyIDwtIHJtczo6cm9iY292KG1vZGVsX2FpZHBzX2NvcnIsIGRpc3NfZGYkR1dObykNCg0KDQptb2RlbF9saXN0IDwtIGxpc3QobW9kZWxfYWlkcHNfc3BlbmRpbmdfY2FiSU5DLCANCiAgICAgICAgICAgICAgICAgICBtb2RlbF9haWRwc19zcGVuZGluZywgDQogICAgICAgICAgICAgICAgICAgbW9kZWxfYWlkcHNfY29ycl9jYWJpbmMsIA0KICAgICAgICAgICAgICAgICAgIG1vZGVsX2FpZHBzX2NvcnIpDQoNCg0KY29lZl9uYW1lX21hcCA8LSBsaXN0KA0KICAgICAgICAgICAgICAgICAgICAgIGNhYmluZXRJTkMgPSAiUG93ZXItU2hhcmluZyAoYmluYXJ5KSIsDQogICAgICAgICAgICAgICAgICAgICAgImNhYmluZXRJTkMgKiBhaWRkYXRhX0FpZEdEUF9sbiIgPSAiUG93ZXItU2hhcmluZyAoYmluYXJ5KSAqIEFpZCIsDQogICAgICAgICAgICAgICAgICAgICAgY2FiaW5ldENPVU5UID0gIlBvd2VyLVNoYXJpbmcgKGNhYmluZXQpIiwNCiAgICAgICAgICAgICAgICAgICAgICAiY2FiaW5ldENPVU5UICogYWlkZGF0YV9BaWRHRFBfbG4iID0gIlBvd2VyLVNoYXJpbmcgKGNhYmluZXQpICogQWlkIiwgDQogICAgICAgICAgICAgICAgICAgICAgImNhYmluZXRDT1VOVDphaWRkYXRhX0FpZEdEUF9sbiIgPSAiUFMgKGNhYmluZXQpICogQWlkIiwNCiAgICAgICAgICAgICAgICAgICAgICBwc19zaGFyZSA9ICJQUyAoY2FiaW5ldCBzaGFyZSkiLA0KICAgICAgICAgICAgICAgICAgICAgICJwc19zaGFyZSAqIGFpZGRhdGFfQWlkR0RQX2xuIiA9ICJQUyAoY2FiaW5ldCBzaGFyZSkgKiBBaWQiLA0KICAgICAgICAgICAgICAgICAgICAgIGRnYV9nZHBfemVybyA9ICJER0EvR0RQIChsb2cpIiwgDQogICAgICAgICAgICAgICAgICAgICAgcHJvZ3JhbV9haWRfZ2RwX3plcm8gPSAiUHJvZ3JhbSBBaWQvR0RQIChsb2cpIiwgDQogICAgICAgICAgICAgICAgICAgICAgY29tbW9kaXR5X2FpZF9nZHBfemVybyA9ICJCdWRnZXQgQWlkL0dEUCAobG9nKSIsIA0KICAgICAgICAgICAgICAgICAgICAgIGFpZGRhdGFfQWlkR0RQX2xuID0gIkFpZCAvIEdEUCAobG9nKSIsDQogICAgICAgICAgICAgICAgICAgICAgDQogICAgICAgICAgICAgICAgICAgICAgbG5fZ2RwX3BjID0gIkdEUCBwL2MgKGxvZykiLA0KICAgICAgICAgICAgICAgICAgICAgIGxuX3BvcCA9ICJQb3B1bGF0aW9uIChsb2cpIiwNCiAgICAgICAgICAgICAgICAgICAgICBjb25mX2ludGVucyA9ICJDb25mbGljdCBJbnRlbnNpdHkiLA0KICAgICAgICAgICAgICAgICAgICAgIG5vbnN0YXRlID0gIk5vbi1TdGF0ZSBWaW9sZW5jZSIsDQogICAgICAgICAgICAgICAgICAgICAgV0JuYXRyZXMgPSAiTmF0LiBSZXMuIFJlbnRzIiwNCiAgICAgICAgICAgICAgICAgICAgICBwb2xpdHkyID0gIlBvbGl0eSIsDQogICAgICAgICAgICAgICAgICAgICAgZmggPSAiUmVnaW1lIFR5cGUgKEZIKSIsDQogICAgICAgICAgICAgICAgICAgICAgRXRobmljID0gIkV0aG5pYyBGcmFjLiIsDQogICAgICAgICAgICAgICAgICAgICAgRFNfb3JkaW5hbCA9ICJVTiBQS08iKQ0KDQojIGN1c3RvbSBmdW5jdGlvbnMgdG8gd3JpdGUgdGV4IG91dHB1dA0KIyBzb3VyY2UoImZ1bmN0aW9ucy9leHRyYWN0X29sc19jdXN0b20uUiIpDQpzb3VyY2UoIi4vZnVuY3Rpb25zL2N1c3RvbV90ZXhyZWcuUiIpDQplbnZpcm9ubWVudChjdXN0b21fdGV4cmVnKSA8LSBhc05hbWVzcGFjZSgndGV4cmVnJykNCiMgDQojIGN1c3RvbV90ZXhyZWcobW9kZWxfbGlzdCwgDQojICAgICAgICAgICAgICAgc3RhcnMgPSBjKDAuMDAxLCAwLjAxLCAwLjA1LCAwLjEpLA0KIyAgICAgICAgICAgICAgIGN1c3RvbS5jb2VmLm1hcCA9IGNvZWZfbmFtZV9tYXAsDQojICAgICAgICAgICAgICAgc3ltYm9sID0gIisiLA0KIyAgICAgICAgICAgICAgIGZpbGUgPSAiLi4vb3V0cHV0L3BzYWlkX3B1Ymdvb2RzLnRleCIsIA0KIyAgICAgICAgICAgICAgIHRhYmxlID0gRiwNCiMgICAgICAgICAgICAgICBib29rdGFicyA9IFQsDQojICAgICAgICAgICAgICAgdXNlLnBhY2thZ2VzID0gRiwNCiMgICAgICAgICAgICAgICBkY29sdW1uID0gVCwNCiMgICAgICAgICAgICAgICBjdXN0b20ubXVsdGljb2wgPSBULA0KIyAgICAgICAgICAgICAgIGN1c3RvbS5tb2RlbC5uYW1lcyA9IGMoIiBcXG11bHRpY29sdW1uezJ9e2N9eyBcXHRleHRiZntQdWJsaWMgdnMuIFBhcnRpY3VsYXJpc3RpYyBTcGVuZGluZ319ICYgXFxtdWx0aWNvbHVtbnsyfXtjfXsgXFx0ZXh0YmZ7UG9saXRpY2FsIENvcnJ1cHRpb259fSBcXFxcIFxcY21pZHJ1bGUocil7Mi0zfSBcXGNtaWRydWxlKGwpezQtNX0gJiBcXG11bHRpY29sdW1uezF9e2N9eygxKSAgfSIsDQojICAgICAgICAgICAgICAgICAgICAgICAgICAgICAgICAgICAgICAiXFxtdWx0aWNvbHVtbnsxfXtjfXsoMikgIH0iLA0KIyAgICAgICAgICAgICAgICAgICAgICAgICAgICAgICAgICAgICAgIlxcbXVsdGljb2x1bW57MX17Y317KDMpICB9IiwNCiMgICAgICAgICAgICAgICAgICAgICAgICAgICAgICAgICAgICAgICJcXG11bHRpY29sdW1uezF9e2N9eyg0KSAgfSIpLA0KIyAgICAgICAgICAgICAgIGluY2x1ZGUuY2x1c3RlciA9IFQsIA0KIyAgICAgICAgICAgICAgIGluY2x1ZGUucnNxdWFyZWQgPSBGLCANCiMgICAgICAgICAgICAgICBzdGFyLnN5bWJvbCA9ICJcXCoiLCANCiMgICAgICAgICAgICAgICBpbmNsdWRlLmxyID0gRikNCg0KdGV4cmVnOjpodG1scmVnKG1vZGVsX2xpc3QsIA0KICAgICAgICAgICAgICAgIHN0YXJzID0gYygwLjAwMSwgMC4wMSwgMC4wNSwgMC4xKSwNCiAgICAgICAgICAgICAgICBjdXN0b20uY29lZi5tYXAgPSBjb2VmX25hbWVfbWFwLA0KICAgICAgICAgICAgICAgIHN5bWJvbCA9ICIrIiwNCiAgICAgICAgdGFibGUgPSBGLA0KICAgICAgICBib29rdGFicyA9IFQsDQogICAgICAgIHVzZS5wYWNrYWdlcyA9IEYsDQogICAgICAgIGRjb2x1bW4gPSBULA0KICAgICAgICBpbmNsdWRlLmNsdXN0ZXIgPSBULCANCiAgICAgICAgaW5jbHVkZS5yc3F1YXJlZCA9IEYsIA0KICAgICAgICBzdGFyLnN5bWJvbCA9ICJcXCoiLCANCiAgICAgICAgaW5jbHVkZS5sciA9IEYsIA0KICAgICAgICBjYXB0aW9uID0gIiIpDQoNCg0KYGBgDQoNCg0KDQojIFRhYmxlIDguMzogUm9idXN0bmVzcyBDaGVja3M6IFBvd2VyLVNoYXJpbmcsIEZvcmVpZ24gQWlkIGFuZCBQb3N0LUNvbmZsaWN0IFByb3Zpc2lvbiBvZiBQdWJsaWMgR29vZHMNCg0KYGBge3IsIHJlc3VsdHM9ImFzaXMiLCBtZXNzYWdlPUYsIHdhcm5pbmc9RiwgY2FjaGUgPSBULCBjb21tZW50cyA9IEZ9DQoNCiMgTGlicmFyaWVzDQpsaWJyYXJ5KHRleHJlZykNCnNvdXJjZSgiZnVuY3Rpb25zL2V4dHJhY3Rfb2xzX2N1c3RvbS5SIikNCnNvdXJjZSgiLi9mdW5jdGlvbnMvZXh0cmFjdF9wbG1fY3VzdG9tLlIiKQ0KDQpsaWJyYXJ5KHJtcykNCmxpYnJhcnkoY291bnRyeWNvZGUpDQoNCg0KIyBsb2FkIERhdGENCmxvYWQoIi4vZGF0YS9kaXNzX2RmLnJkYSIpDQoNCg0KbW9kZWxfYWlkcHNfc3BlbmRpbmdfZXRobmljIDwtIG9scyh2MmRsZW5jbXBzX3QxIH4NCiAgICAgICAgICAgICAgICAgICAgICAgICAgICAgIGNhYmluZXRJTkMgKiAgDQogICAgICAgICAgICAgICAgICAgICAgICAgICAgICBhaWRkYXRhX0FpZEdEUF9sbiArDQogICAgICAgICAgICAgICAgICAgICAgICAgICAgICBsbl9nZHBfcGMgKw0KICAgICAgICAgICAgICAgICAgICAgICAgICAgICAgbG5fcG9wICsNCiAgICAgICAgICAgICAgICAgICAgICAgICAgICAgIGNvbmZfaW50ZW5zICsNCiAgICAgICAgICAgICAgICAgICAgICAgICAgICAgIG5vbnN0YXRlICsNCiAgICAgICAgICAgICAgICAgICAgICAgICAgICAgIFdCbmF0cmVzICsgDQogICAgICAgICAgICAgICAgICAgICAgICAgICAgICBmaCArDQogICAgICAgICAgICAgICAgICAgICAgICAgICAgICBFdGhuaWMsDQogICAgICAgICAgICAgICAgICAgICAgICAgICAgZGF0YT1kaXNzX2RmLCB4PVQsIHk9VCkNCm1vZGVsX2FpZHBzX3NwZW5kaW5nX2V0aG5pYyA8LSBybXM6OnJvYmNvdihtb2RlbF9haWRwc19zcGVuZGluZ19ldGhuaWMsIGRpc3NfZGYkR1dObykNCg0KDQptb2RlbF9haWRwc19zcGVuZGluZ19wa28gPC0gb2xzKHYyZGxlbmNtcHNfdDEgfg0KICAgICAgICAgICAgICAgICAgICAgICAgICAgICAgY2FiaW5ldElOQyAqICANCiAgICAgICAgICAgICAgICAgICAgICAgICAgICAgIGFpZGRhdGFfQWlkR0RQX2xuICsNCiAgICAgICAgICAgICAgICAgICAgICAgICAgICAgIGxuX2dkcF9wYyArDQogICAgICAgICAgICAgICAgICAgICAgICAgICAgICBsbl9wb3AgKw0KICAgICAgICAgICAgICAgICAgICAgICAgICAgICAgY29uZl9pbnRlbnMgKw0KICAgICAgICAgICAgICAgICAgICAgICAgICAgICAgbm9uc3RhdGUgKw0KICAgICAgICAgICAgICAgICAgICAgICAgICAgICAgV0JuYXRyZXMgKyANCiAgICAgICAgICAgICAgICAgICAgICAgICAgICAgIGZoICsNCiAgICAgICAgICAgICAgICAgICAgICAgICAgICAgIERTX29yZGluYWwsDQogICAgICAgICAgICAgICAgICAgICAgICAgICAgZGF0YT1kaXNzX2RmLCB4PVQsIHk9VCkNCm1vZGVsX2FpZHBzX3NwZW5kaW5nX3BrbyA8LSBybXM6OnJvYmNvdihtb2RlbF9haWRwc19zcGVuZGluZ19wa28sIGRpc3NfZGYkR1dObykNCg0KIyBDYWJpbmV0IFNoYXJlDQoNCmxpYnJhcnkocmVhZHhsKQ0KY250cyA8LSByZWFkX2V4Y2VsKCIuL2RhdGEvQ05UU0RBVEEueGxzIikNCg0KY250cyA8LSBjbnRzICU+JSBmaWx0ZXIoeWVhciA+PSAxOTg5KQ0KDQpjbnRzJGlzbzNjIDwtIGNvdW50cnljb2RlKGNudHMkY291bnRyeSwgImNvdW50cnkubmFtZSIsICJpc28zYyIpDQpjbnRzIDwtIGNudHMgJT4lIGZpbHRlcihjb3VudHJ5ICE9ICJTT01BTElMQU5EIikNCg0KdGVzdGNhYnNpemUgPC0gbGVmdF9qb2luKGRpc3NfZGYsIGNudHNbLCBjKCJpc28zYyIsICJ5ZWFyIiwgInBvbGl0MTAiKV0pDQoNCnRlc3RjYWJzaXplJHBzX3NoYXJlIDwtIHRlc3RjYWJzaXplJGNhYmluZXRJTkMgLyB0ZXN0Y2Fic2l6ZSRwb2xpdDEwICogMTAwDQoNCm1vZGVsX2NhYnNpemVfc3BlbmRpbmcgPC0gb2xzKHYyZGxlbmNtcHNfdDEgfg0KICAgICAgICAgICAgICAgICAgICAgICBwc19zaGFyZSAqDQogICAgICAgICAgICAgICAgICAgICAgIGFpZGRhdGFfQWlkR0RQX2xuICsNCiAgICAgICAgICAgICAgICAgICAgICAgbG5fZ2RwX3BjICsNCiAgICAgICAgICAgICAgICAgICAgICAgbG5fcG9wICsNCiAgICAgICAgICAgICAgICAgICAgICAgY29uZl9pbnRlbnMgKw0KICAgICAgICAgICAgICAgICAgICAgICBub25zdGF0ZSArDQogICAgICAgICAgICAgICAgICAgICAgIFdCbmF0cmVzICsNCiAgICAgICAgICAgICAgICAgICAgICAgZmgsDQogICAgICAgICAgICAgICAgICAgICBkYXRhID0gdGVzdGNhYnNpemUsIHggPSBULCB5ID0gVCkNCm1vZGVsX2NhYnNpemVfc3BlbmRpbmcgPC0gcm9iY292KG1vZGVsX2NhYnNpemVfc3BlbmRpbmcsIHRlc3RjYWJzaXplJEdXTm8pDQoNCiMgcGVyc29uYWxpc3QgcG9saXRpY3MNCnBlcnNvbmFsaXN0IDwtIHJlYWRfZXhjZWwoIi4vZGF0YS9hdXRvcmVnaW1lNS54bHMiKSAlPiUgDQogIGRwbHlyOjpzZWxlY3QoY293Y29kZSwgeWVhciwgcGVyc2FnZzFueSwgcGVyc2FnZ255MikNCg0KDQpkaXNzX2RmIDwtIGxlZnRfam9pbihkaXNzX2RmLCBwZXJzb25hbGlzdCwgDQogICAgICAgICAgICAgICAgICBieSA9IGMoIkdXTm8iID0gImNvd2NvZGUiLCAieWVhciIpKQ0KDQptb2RlbF9haWRwc19zcGVuZGluZ19wZXJzb25hbGlzdCA8LSBvbHModjJkbGVuY21wc190MSB+DQogICAgICAgICAgICAgICAgICAgICAgICAgICAgICAgICAgY2FiaW5ldElOQyAqICANCiAgICAgICAgICAgICAgICAgICAgICAgICAgICAgICAgICBhaWRkYXRhX0FpZEdEUF9sbiArDQogICAgICAgICAgICAgICAgICAgICAgICAgICAgICAgICAgbG5fZ2RwX3BjICsNCiAgICAgICAgICAgICAgICAgICAgICAgICAgICAgICAgICBsbl9wb3AgKw0KICAgICAgICAgICAgICAgICAgICAgICAgICAgICAgICAgIGNvbmZfaW50ZW5zICsNCiAgICAgICAgICAgICAgICAgICAgICAgICAgICAgICAgICBub25zdGF0ZSArDQogICAgICAgICAgICAgICAgICAgICAgICAgICAgICAgICAgV0JuYXRyZXMgKyANCiAgICAgICAgICAgICAgICAgICAgICAgICAgICAgICAgICBmaCArDQogICAgICAgICAgICAgICAgICAgICAgICAgICAgICAgICAgICBwZXJzYWdnbnkyLA0KICAgICAgICAgICAgICAgICAgICAgICAgICAgICAgICBkYXRhPWRpc3NfZGYsIHg9VCwgeT1UKQ0KbW9kZWxfYWlkcHNfc3BlbmRpbmdfcGVyc29uYWxpc3QgPC0gcm1zOjpyb2Jjb3YobW9kZWxfYWlkcHNfc3BlbmRpbmdfcGVyc29uYWxpc3QsIA0KICAgICAgICAgICAgICAgICAgICAgICAgICAgICAgICAgICAgICAgICAgICAgZGlzc19kZiRHV05vKQ0KDQojIFJhbmRvbSBFZmZlY3RzIA0KbGlicmFyeShwbG0pDQptb2RlbF9haWRwc19zcGVuZGluZ19yZSA8LSBwbG0odjJkbGVuY21wc190MSB+DQogICAgICAgICAgICAgICAgICAgICAgICAgICAgICAgICBjYWJpbmV0SU5DICogIA0KICAgICAgICAgICAgICAgICAgICAgICAgICAgICAgICAgYWlkZGF0YV9BaWRHRFBfbG4gKw0KICAgICAgICAgICAgICAgICAgICAgICAgICAgICAgICAgbG5fZ2RwX3BjICsNCiAgICAgICAgICAgICAgICAgICAgICAgICAgICAgICAgIGxuX3BvcCArDQogICAgICAgICAgICAgICAgICAgICAgICAgICAgICAgICBjb25mX2ludGVucyArDQogICAgICAgICAgICAgICAgICAgICAgICAgICAgICAgICBub25zdGF0ZSArDQogICAgICAgICAgICAgICAgICAgICAgICAgICAgICAgICBXQm5hdHJlcyArIA0KICAgICAgICAgICAgICAgICAgICAgICAgICAgICAgICAgZmgsDQogICAgICAgICAgICAgICAgICAgICAgICAgICAgICAgDQogICAgICAgICAgICAgICAgICAgICAgICAgICAgICAgZGF0YT1kaXNzX2RmLCB4PVQsIHk9VCwgDQogICAgICAgICAgICAgICAgICAgICAgICAgICAgICAgbW9kZWwgPSAicmFuZG9tIiwgDQogICAgICAgICAgICAgICAgICAgICAgICAgICAgICAgaW5kZXggPSBjKCJHV05vIiwgInllYXIiKSkNCm1vZGVsX2FpZHBzX3NwZW5kaW5nX3JlJHZjb3YgPC0gcGxtOjp2Y292SEMobW9kZWxfYWlkcHNfc3BlbmRpbmdfcmUpDQoNCiMgUmVnaW9uIEZpeGVkIEVmZmVjdHMNCmRpc3NfZGYkcmVnaW9uRkUgPC0gY291bnRyeWNvZGUoZGlzc19kZiRMb2NhdGlvbiwgImNvdW50cnkubmFtZSIsICJyZWdpb24iKQ0KZGlzc19kZiR5ZWFyRkUgPC0gYXMuZmFjdG9yKGRpc3NfZGYkeWVhcikNCm1vZGVsX2FpZHBzX3NwZW5kaW5nX3JlZ2lvbkZFIDwtIG9scyh2MmRsZW5jbXBzX3QxIH4NCiAgICAgICAgICAgICAgICAgICAgICAgICAgICAgICAgICBjYWJpbmV0SU5DICogIA0KICAgICAgICAgICAgICAgICAgICAgICAgICAgICAgICAgIGFpZGRhdGFfQWlkR0RQX2xuICsNCiAgICAgICAgICAgICAgICAgICAgICAgICAgICAgICAgICBsbl9nZHBfcGMgKw0KICAgICAgICAgICAgICAgICAgICAgICAgICAgICAgICAgIGxuX3BvcCArDQogICAgICAgICAgICAgICAgICAgICAgICAgICAgICAgICAgY29uZl9pbnRlbnMgKw0KICAgICAgICAgICAgICAgICAgICAgICAgICAgICAgICAgICAgbm9uc3RhdGUgKw0KICAgICAgICAgICAgICAgICAgICAgICAgICAgICAgICAgICAgV0JuYXRyZXMgKyANCiAgICAgICAgICAgICAgICAgICAgICAgICAgICAgICAgICAgIGZoICsNCiAgICAgICAgICAgICAgICAgICAgICAgICAgICAgICAgICAgIHJlZ2lvbkZFICwNCiAgICAgICAgICAgICAgICAgICAgICAgICAgICAgICAgICBkYXRhPWRpc3NfZGYsIHg9VCwgeT1UKQ0KbW9kZWxfYWlkcHNfc3BlbmRpbmdfcmVnaW9uRkUgPC0gcm1zOjpyb2Jjb3YobW9kZWxfYWlkcHNfc3BlbmRpbmdfcmVnaW9uRkUsIA0KICAgICAgICAgICAgICAgICAgICAgICAgICAgICAgICAgICAgICAgICAgICAgZGlzc19kZiRHV05vKQ0KDQojIG1vZGVsX2FpZHBzX3NwZW5kaW5nX2NudHJ5RkUgPC0gbGZlOjpmZWxtKHYyZGxlbmNtcHNfdDEgfg0KIyAgICAgICAgICAgICAgICAgICAgICAgICAgICAgICAgICAgY2FiaW5ldElOQyAqDQojICAgICAgICAgICAgICAgICAgICAgICAgICAgICAgICAgICBsb2coY29tbW9kaXR5X2FpZF9nZHAgKyAxKSArDQojICAgICAgICAgICAgICAgICAgICAgICAgICAgICAgICAgICAgIGFpZGRhdGFfQWlkR0RQX2xuICsNCiMgICAgICAgICAgICAgICAgICAgICAgICAgICAgICAgICAgIGxuX2dkcF9wYyArDQojICAgICAgICAgICAgICAgICAgICAgICAgICAgICAgICAgICBsbl9wb3AgKw0KIyAgICAgICAgICAgICAgICAgICAgICAgICAgICAgICAgICAgY29uZl9pbnRlbnMgKw0KIyAgICAgICAgICAgICAgICAgICAgICAgICAgICAgICAgICAgICBub25zdGF0ZSArDQojICAgICAgICAgICAgICAgICAgICAgICAgICAgICAgICAgICAgIFdCbmF0cmVzICsNCiMgICAgICAgICAgICAgICAgICAgICAgICAgICAgICAgICAgICAgZmggfCBHV05vIHwgMCB8IEdXTm8sDQojICAgICAgICAgICAgICAgICAgICAgICAgICAgICAgICAgICBkYXRhPWRpc3NfZGYsIGV4YWN0RE9GID0gVCkNCg0KDQptb2RlbF9saXN0IDwtIGxpc3QobW9kZWxfYWlkcHNfc3BlbmRpbmdfZXRobmljLCANCiAgICAgICAgICAgICAgICAgICBtb2RlbF9haWRwc19zcGVuZGluZ19wa28sIA0KICAgICAgICAgICAgICAgICAgIG1vZGVsX2NhYnNpemVfc3BlbmRpbmcsIA0KICAgICAgICAgICAgICAgICAgICBtb2RlbF9haWRwc19zcGVuZGluZ19wZXJzb25hbGlzdCwgDQogICAgICAgICAgICAgICAgICAgbW9kZWxfYWlkcHNfc3BlbmRpbmdfcmUsDQogICAgICAgICAgICAgICAgICAgbW9kZWxfYWlkcHNfc3BlbmRpbmdfcmVnaW9uRkUpDQoNCiMjIE9yZGVyIG9mIGNvZWZmaWNpZW50cyBpbiBvdXRwdXQgdGFibGUNCm5hbWVfbWFwX3JvYnVzdG5lc3MgPC0gbGlzdChjYWJpbmV0SU5DID0gIlBvd2VyLVNoYXJpbmcgKGJpbmFyeSkiLA0KICAgICAgICAgICAgICAgICAgICAgICAgICAgICJjYWJpbmV0SU5DICogYWlkZGF0YV9BaWRHRFBfbG4iID0gIlBTIChiaW5hcnkpICogQWlkIiwgDQogICAgICAgICAgICAgICAgICAgICAgICAgICAgImNhYmluZXRJTkM6YWlkZGF0YV9BaWRHRFBfbG4iID0gIlBTIChiaW5hcnkpICogQWlkIiwNCiAgICAgICAgICAgICAgICAgICAgICAgICAgICBwc19zaGFyZSA9ICJQUyAoY2FiaW5ldCBzaGFyZSkiLA0KICAgICAgICAgICAgICAgICAgICAgICAgICAgICJwc19zaGFyZSAqIGFpZGRhdGFfQWlkR0RQX2xuIiA9ICJQUyAoY2FiaW5ldCBzaGFyZSkgKiBBaWQiLA0KICAgICAgICAgICAgICAgICAgICAgICAgICAgIGFpZGRhdGFfQWlkR0RQX2xuID0gIkFpZCAvIEdEUCAobG9nKSIsDQogICAgICAgICAgICAgICAgICAgICAgICAgICAgbG5fZ2RwX3BjID0gIkdEUCBwL2MiLA0KICAgICAgICAgICAgICAgICAgICAgICAgICAgIGxuX3BvcCA9ICJQb3B1bGF0aW9uIiwNCiAgICAgICAgICAgICAgICAgICAgICAgICAgICBjb25mX2ludGVucyA9ICJDb25mbGljdCBJbnRlbnNpdHkiLA0KICAgICAgICAgICAgICAgICAgICAgICAgICAgIG5vbnN0YXRlID0gIk5vbi1TdGF0ZSBWaW9sZW5jZSIsDQogICAgICAgICAgICAgICAgICAgICAgICAgICAgV0JuYXRyZXMgPSAiTmF0LiBSZXMuIFJlbnRzIiwNCiAgICAgICAgICAgICAgICAgICAgICAgICAgICBwb2xpdHkyID0gIlBvbGl0eSIsDQogICAgICAgICAgICAgICAgICAgICAgICAgICAgZmggPSAiUmVnaW1lIFR5cGUgKEZIKSIsDQogICAgICAgICAgICAgICAgICAgICAgICAgICAgRXRobmljID0gIkV0aG5pYyBGcmFjLiIsDQogICAgICAgICAgICAgICAgICAgICAgICAgICAgRFNfb3JkaW5hbCA9ICJVTiBQS08iLA0KICAgICAgICAgICAgICAgICAgICAgICAgICAgIHBlcnNhZ2dueTIgPSAiUGVyc29uYWxpc20gSW5kZXgiLA0KICAgICAgICAgICAgICAgICAgICAgICAgICAgIHNwZW5kaW5nX3JlZ2lvbmFsX21lYW4gPSAiUGFydC4gU3BlbmRpbmcgUmVnaW9uYWwgTWVhbiIsIA0KICAgICAgICAgICAgICAgICAgICAgICAgICAgIGNvbW1vbmxhdyA9ICJDb21tb24gTGF3IiwgDQogICAgICAgICAgICAgICAgICAgICAgICAgICAgZHVyYXRpb25fY29uc3RpdHV0aW9uID0gIkNvbnN0LiBEdXJhdGlvbiIpDQoNCg0Kc291cmNlKCIuL2Z1bmN0aW9ucy9jdXN0b21fdGV4cmVnLlIiKQ0KZW52aXJvbm1lbnQoY3VzdG9tX3RleHJlZykgPC0gYXNOYW1lc3BhY2UoJ3RleHJlZycpDQoNCiMgDQojICMgT3V0cHV0IE1hbnVzY3JpcHQNCiMgY3VzdG9tX3RleHJlZyhsID0gbW9kZWxfbGlzdCwNCiMgICAgICAgICBzdGFycyA9IGMoMC4wMDEsIDAuMDEsIDAuMDUsIDAuMSksDQojICAgICAgICAgc3ltYm9sID0gIisiLA0KIyAgICAgICAgIHRhYmxlID0gRiwNCiMgICAgICAgICBib29rdGFicyA9IFQsDQojICAgICAgICAgdXNlLnBhY2thZ2VzID0gRiwNCiMgICAgICAgICBkY29sdW1uID0gVCwNCiMgICAgICAgICBjdXN0b20uY29lZi5tYXAgPSBuYW1lX21hcF9yb2J1c3RuZXNzLA0KIyAgICAgICAgIGZpbGUgPSAiLi4vb3V0cHV0L2FpZHBzX3NwZW5kaW5nX3JvYnVzdG5lc3MudGV4IiwNCiMgICAgICAgICBjdXN0b20ubW9kZWwubmFtZXMgPSBjKCIoMSkgRUxGIiwNCiMgICAgICAgICAgICAgICAgICAgICAgICAgICAgICAgICIoMikgUEtPIiwNCiMgICAgICAgICAgICAgICAgICAgICAgICAgICAgICAgICIoMykgQ2FiLiBTaXplIiwNCiMgICAgICAgICAgICAgICAgICAgICAgICAgICAgICAgICIoNCkgUGVyc29uYWxpc3QgUG9saXRpY3MiLCANCiMgICAgICAgICAgICAgICAgICAgICAgICAgICAgICAgICIoNSkgUkUiLA0KIyAgICAgICAgICAgICAgICAgICAgICAgICAgICAgICAgIig2KSBSZWdpb24gRkUiKSwNCiMgICAgICAgIA0KIyAgICAgICAgIHN0YXIuc3ltYm9sID0gIlxcKiIsDQojICAgICAgICAgaW5jbHVkZS5sciA9IEYsIA0KIyAgICAgICAgIGluY2x1ZGUuY2x1c3RlciA9IFQsIA0KIyAgICAgICAgIGluY2x1ZGUucnNxdWFyZWQgPSBGLCANCiMgICAgICAgICBpbmNsdWRlLnZhcmlhbmNlID0gRikNCg0KIyBPdXRwdXQgUmVwbGljYXRpb24gQXJjaGl2ZQ0KaHRtbHJlZyhsID0gbW9kZWxfbGlzdCwNCiAgICAgICAgc3RhcnMgPSBjKDAuMDAxLCAwLjAxLCAwLjA1LCAwLjEpLA0KICAgICAgICBzeW1ib2wgPSAiKyIsDQogICAgICAgIHRhYmxlID0gRiwNCiAgICAgICAgYm9va3RhYnMgPSBULA0KICAgICAgICB1c2UucGFja2FnZXMgPSBGLA0KICAgICAgICBkY29sdW1uID0gVCwNCiAgICAgICAgY3VzdG9tLmNvZWYubWFwID0gbmFtZV9tYXBfcm9idXN0bmVzcywNCiAgICAgICAgIyBmaWxlID0gIi4uL291dHB1dC9haWRwc19zcGVuZGluZ19yb2J1c3RuZXNzLnRleCIsDQogICAgICAgIGN1c3RvbS5tb2RlbC5uYW1lcyA9IGMoIigxKSBFTEYiLA0KICAgICAgICAgICAgICAgICAgICAgICAgICAgICAgICIoMikgUEtPIiwNCiAgICAgICAgICAgICAgICAgICAgICAgICAgICAgICAiKDMpIENhYi4gU2l6ZSIsDQogICAgICAgICAgICAgICAgICAgICAgICAgICAgICAgIig0KSBQZXJzb25hbGlzdCBQb2xpdGljcyIsIA0KICAgICAgICAgICAgICAgICAgICAgICAgICAgICAgICIoNSkgUkUiLA0KICAgICAgICAgICAgICAgICAgICAgICAgICAgICAgICIoNikgUmVnaW9uIEZFIiksDQogICAgICAgDQogICAgICAgIHN0YXIuc3ltYm9sID0gIlxcKiIsDQogICAgICAgIGluY2x1ZGUubHIgPSBGLCANCiAgICAgICAgaW5jbHVkZS5jbHVzdGVyID0gVCwgDQogICAgICAgIGluY2x1ZGUucnNxdWFyZWQgPSBGLCANCiAgICAgICAgaW5jbHVkZS52YXJpYW5jZSA9IEYpDQoNCmBgYA0KDQoNCg0KIyBUYWJsZSA4LjQ6IFBvd2VyLVNoYXJpbmcsIEZvcmVpZ24gQWlkIGFuZCBQb3N0LUNvbmZsaWN0IFByb3Zpc2lvbiBvZiBQdWJsaWMgR29vZHM6IE1hdGNoaW5nIGFuZCAyU0xTIFJlc3VsdHMNCg0KDQpgYGB7ciwgcmVzdWx0cz0iYXNpcyIsIG1lc3NhZ2U9Riwgd2FybmluZz1GLCBjYWNoZSA9IFQsIGNvbW1lbnRzID0gRn0NCg0KIyBMaWJyYXJpZXMNCmxpYnJhcnkodGV4cmVnKQ0Kc291cmNlKCJmdW5jdGlvbnMvZXh0cmFjdF9vbHNfY3VzdG9tLlIiKQ0KbGlicmFyeShybXMpDQpsaWJyYXJ5KGNvdW50cnljb2RlKQ0KDQoNCiMgbG9hZCBEYXRhDQpsb2FkKCIuL2RhdGEvZGlzc19kZi5yZGEiKQ0KDQoNCg0KIyAxLiBNYXRjaGluZyAtLS0tLS0tLS0tLS0tLS0tLS0tLS0tLS0tLS0tLS0tLS0tLS0tLS0tLS0tLS0tLS0tLS0tLS0tLS0tLS0tDQpsaWJyYXJ5KE1hdGNoSXQpDQpsaWJyYXJ5KHRpZHlyKQ0KDQojIHByZXBhcmUgZGF0YSB3aXRob3V0IG1pc3NpbmdzDQptYXRjaF9zcGVuZF9kYXRhIDwtIGRpc3NfZGYgJT4lIA0KICB1bmdyb3VwKCkgJT4lIA0KICBkcGx5cjo6c2VsZWN0KGNhYmluZXRJTkMsIGNhYmluZXRDT1VOVCwgc2VuaW9ySU5DLA0KICAgICAgICAgICAgICAgIHNlbmlvckNPVU5ULCBub25zZW5pb3JJTkMsIG5vbnNlbmlvckNPVU5ULA0KICAgICAgICAgICAgICAgIGFpZGRhdGFfQWlkR0RQLCBwb3B1bGF0aW9uLCBub25zdGF0ZSwNCiAgICAgICAgICAgICAgICBXQm5hdHJlcywgZmgsIEdEUF9wZXJfY2FwaXRhLCBjb25mX2ludGVucywNCiAgICAgICAgICAgICAgICBhaWRkYXRhX0FpZEdEUF9sbiwgR1dObywgeWVhciwgDQogICAgICAgICAgICAgICAgIyBjb21tb2RpdHlfYWlkX2dkcF9sbiwNCiAgICAgICAgICAgICAgICBwY19wZXJpb2QsIExvY2F0aW9uLCBsbl9wb3AsIGxuX2dkcF9wYywNCiAgICAgICAgICAgICAgICB2MmRsZW5jbXBzX3QxLCB2MnhfY29ycl90MSkNCg0KbWF0Y2hfc3BlbmRfZGF0YSA8LSBtYXRjaF9zcGVuZF9kYXRhW2NvbXBsZXRlLmNhc2VzKG1hdGNoX3NwZW5kX2RhdGEpLCBdDQoNCiMgZ2VuZXJhdGUgcHJldHJlYXRtZW50IGNvbnRyb2xzDQptYXRjaF9zcGVuZF9kYXRhIDwtIG1hdGNoX3NwZW5kX2RhdGEgJT4lIA0KICBhcnJhbmdlKEdXTm8sIHBjX3BlcmlvZCwgeWVhcikgJT4lIA0KICBncm91cF9ieShHV05vLCBwY19wZXJpb2QpICU+JSANCiAgbXV0YXRlKG1hdGNoX2FpZGRhdGFfQWlkR0RQX2xuID0gZmlyc3QoYWlkZGF0YV9BaWRHRFBfbG4pLA0KICAgICAgICAgbWF0Y2hfcG9wID0gZmlyc3QocG9wdWxhdGlvbiksDQogICAgICAgICBtYXRjaF9nZHAgPSBmaXJzdChHRFBfcGVyX2NhcGl0YSksDQogICAgICAgICBtYXRjaF9ub25zdGF0ZSA9IGZpcnN0KG5vbnN0YXRlKSwNCiAgICAgICAgIG1hdGNoX1dCbmF0cmVzID0gZmlyc3QoV0JuYXRyZXMpLA0KICAgICAgICAgbWF0Y2hfZmggPSBmaXJzdChmaCkpDQoNCiMgY29udmVydCBiYWNrIHRvIGRhdGEgZnJhbWUNCm1hdGNoX3NwZW5kX2RhdGEgPC0gYXMuZGF0YS5mcmFtZShtYXRjaF9zcGVuZF9kYXRhKQ0KDQoNCg0KIyAxLjEgUGVyZm9ybSBNYXRjaGluZyAtLS0tLS0tLS0tLS0tLS0tLS0tLS0tLS0tLS0tLS0tLS0tLS0tLS0tLS0tLS0tLS0tLS0tDQpzZXQuc2VlZCgxMjMpDQoNCiMgcGVyZm9ybSBtYXRjaGluZyBhbGdvcml0aG0NCm1hdGNoX3NwZW5kX3JlcyA8LSBtYXRjaGl0KGNhYmluZXRJTkMgfg0KICAgICAgICAgICAgICAgICAgICAgICAgICBtYXRjaF9haWRkYXRhX0FpZEdEUF9sbiArDQogICAgICAgICAgICAgICAgICAgICAgICAgIGxvZyhtYXRjaF9nZHApICsNCiAgICAgICAgICAgICAgICAgICAgICAgICAgbG9nKG1hdGNoX3BvcCkgKw0KICAgICAgICAgICAgICAgICAgICAgICAgICBjb25mX2ludGVucyArICMgY29uZl9pbnRlbnMgaXMgYWxyZWFkeSBwcmUtdHJlYXRtZW50DQogICAgICAgICAgICAgICAgICAgICAgICAgIG1hdGNoX25vbnN0YXRlICsNCiAgICAgICAgICAgICAgICAgICAgICAgICAgbG9nKG1hdGNoX1dCbmF0cmVzICsgMSkgICsNCiAgICAgICAgICAgICAgICAgICAgICAgICAgbWF0Y2hfZmggLA0KICAgICAgICAgICAgICAgICAgICAgICAgbWV0aG9kID0gIm5lYXJlc3QiLA0KICAgICAgICAgICAgICAgICAgICAgICAgcmF0aW8gPSAyLA0KICAgICAgICAgICAgICAgICAgICAgICAgZGlzdGFuY2UgPSAibWFoYWxhbm9iaXMiLA0KICAgICAgICAgICAgICAgICAgICAgICAgZGF0YSA9IG1hdGNoX3NwZW5kX2RhdGEpDQoNCiMgZXh0cmFjdCBkYXRhDQptYXRjaF9zcGVuZF9kZiA8LSBtYXRjaC5kYXRhKG1hdGNoX3NwZW5kX3JlcykNCg0KDQoNCiMgMS4zIFJlZXN0aW1hdGUgb24gbWF0Y2hlZCBzYW1wbGUgLS0tLS0tLS0tLS0tLS0tLS0tLS0tLS0tLS0tLS0tLS0tLS0tLS0tLQ0KDQojIGFsbA0KbW9kZWxfc3BlbmRfbWF0Y2hlZCA8LSBvbHModjJkbGVuY21wc190MSB+DQogICAgICAgICAgICAgICAgICAgICAgICAgICAgIGNhYmluZXRJTkMgKiAgDQogICAgICAgICAgICAgICAgICAgICAgICAgICAgIGFpZGRhdGFfQWlkR0RQX2xuICsNCiAgICAgICAgICAgICAgICAgICAgICAgICAgICAgbG5fZ2RwX3BjICsNCiAgICAgICAgICAgICAgICAgICAgICAgICAgICAgbG5fcG9wICsNCiAgICAgICAgICAgICAgICAgICAgICAgICAgICAgY29uZl9pbnRlbnMgKw0KICAgICAgICAgICAgICAgICAgICAgICAgICAgICBub25zdGF0ZSArDQogICAgICAgICAgICAgICAgICAgICAgICAgICAgIFdCbmF0cmVzICsgDQogICAgICAgICAgICAgICAgICAgICAgICAgICAgIGZoDQogICAgICAgICAgICAgICAgICAgICAgICAgICAsDQogICAgICAgICAgICAgICAgICAgICAgICAgICBkYXRhPW1hdGNoX3NwZW5kX2RmICwgeD1ULCB5PVQpDQptb2RlbF9zcGVuZF9tYXRjaGVkIDwtIHJtczo6cm9iY292KG1vZGVsX3NwZW5kX21hdGNoZWQsIG1hdGNoX3NwZW5kX2RmJEdXTm8pDQoNCg0KIyBjYWJpbmV0Q09VTlQNCm1vZGVsX3NwZW5kX21hdGNoZWRDT1VOVCA8LSBvbHModjJkbGVuY21wc190MSB+DQogICAgICAgICAgICAgICAgICAgICAgICAgICAgIGNhYmluZXRDT1VOVCAqICANCiAgICAgICAgICAgICAgICAgICAgICAgICAgICAgYWlkZGF0YV9BaWRHRFBfbG4gKw0KICAgICAgICAgICAgICAgICAgICAgICAgICAgICBsbl9nZHBfcGMgKw0KICAgICAgICAgICAgICAgICAgICAgICAgICAgICBsbl9wb3AgKw0KICAgICAgICAgICAgICAgICAgICAgICAgICAgICBjb25mX2ludGVucyArDQogICAgICAgICAgICAgICAgICAgICAgICAgICAgIG5vbnN0YXRlICsNCiAgICAgICAgICAgICAgICAgICAgICAgICAgICAgV0JuYXRyZXMgKyANCiAgICAgICAgICAgICAgICAgICAgICAgICAgICAgZmgNCiAgICAgICAgICAgICAgICAgICAgICAgICAgICwNCiAgICAgICAgICAgICAgICAgICAgICAgICAgIGRhdGE9bWF0Y2hfc3BlbmRfZGYgLCB4PVQsIHk9VCkNCm1vZGVsX3NwZW5kX21hdGNoZWRDT1VOVCA8LSBybXM6OnJvYmNvdihtb2RlbF9zcGVuZF9tYXRjaGVkQ09VTlQsIG1hdGNoX3NwZW5kX2RmJEdXTm8pDQoNCg0KDQojIDIuIEluc3RydW1lbnRhbCBWYXJpYWJsZXMgLS0tLS0tLS0tLS0tLS0tLS0tLS0tLS0tLS0tLS0tLS0tLS0tLS0tLS0tLS0tLS0NCg0KIyAyLjEgRGF0YSBQcmVwYXJhdGlvbiAtLS0tLS0tLS0tLS0tLS0tLS0tLS0tLS0tLS0tLS0tLS0tLS0tLS0tLS0tLS0tLS0tLS0tDQoNCg0KIyBsb2FkIGxpYnJhcmllcw0KbGlicmFyeShBRVIpDQpsaWJyYXJ5KGl2cGFjaykNCmxpYnJhcnkobG10ZXN0KQ0KDQojIGxvYWQgZGF0YSB3aXRoIGluc3RydW1lbnQ7IHRoaXMgZ2l2ZXMgImluc3RydW1lbnRfZGYiIGRhdGEgZnJhbWUNCmxvYWQoZmlsZSA9ICIuL2RhdGEvaW5zdHJ1bWVudGVkQWlkMi5SRGF0YSIpDQoNCmRpc3NfZGZfaXYgPC0gbWVyZ2UoZGlzc19kZiwgDQogICAgICAgICAgICAgICAgICAgICAgaW5zdHJ1bWVudF9kZiwgDQogICAgICAgICAgICAgICAgICAgICAgYnkgPSBjKCJpc28yYyIsICJ5ZWFyIiksIGFsbC54ID0gVFJVRSkNCg0KDQojIHN1YnNldCBvbmx5IGNvbXBsZXRlLmNhc2VzIC8gbmVjZXNzYXJ5IGZvciBjbHVzdGVyLnJvYnVzdC5zZSgpDQppdl9uYSA8LSBuYS5vbWl0KGRpc3NfZGZfaXZbLCBjKCJjYWJpbmV0Q09VTlQiLCANCiAgICAgICAgICAgICAgICAgICAgICAgICAgICAgICAgICAiY2FiaW5ldElOQyIsIA0KICAgICAgICAgICAgICAgICAgICAgICAgICAgICAgICAgICJhaWRkYXRhX0FpZCIsDQogICAgICAgICAgICAgICAgICAgICAgICAgICAgICAgICAgImFpZGRhdGFfQWlkR0RQX2xuIiwNCiAgICAgICAgICAgICAgICAgICAgICAgICAgICAgICAgICANCiAgICAgICAgICAgICAgICAgICAgICAgICAgICAgICAgICAiZmgiLA0KICAgICAgICAgICAgICAgICAgICAgICAgICAgICAgICAgICJHRFBfcGVyX2NhcGl0YSIsIA0KICAgICAgICAgICAgICAgICAgICAgICAgICAgICAgICAgICJwb3B1bGF0aW9uIiwgDQogICAgICAgICAgICAgICAgICAgICAgICAgICAgICAgICAgImNvbmZfaW50ZW5zIiwgDQogICAgICAgICAgICAgICAgICAgICAgICAgICAgICAgICAgIldCbmF0cmVzIiwgDQogICAgICAgICAgICAgICAgICAgICAgICAgICAgICAgICAgInRvdGFsX3N1bV9leGNlcHQiLCANCiAgICAgICAgICAgICAgICAgICAgICAgICAgICAgICAgICAieWVhciIsIA0KICAgICAgICAgICAgICAgICAgICAgICAgICAgICAgICAgICJHV05vIiwgDQogICAgICAgICAgICAgICAgICAgICAgICAgICAgICAgICAgIkdEUCIsDQogICAgICAgICAgICAgICAgICAgICAgICAgICAgICAgICAgIm5vbnN0YXRlIiwgDQogICAgICAgICAgICAgICAgICAgICAgICAgICAgICAgICAgInYyZGxlbmNtcHNfdDEiLCANCiAgICAgICAgICAgICAgICAgICAgICAgICAgICAgICAgICAidjJ4X2NvcnJfdDEiKV0pDQoNCg0KDQojIDIuMiBSZWR1Y2VkIEZvcm0gLS0tLS0tLS0tLS0tLS0tLS0tLS0tLS0tLS0tLS0tLS0tLS0tLS0tLS0tLS0tLS0tLS0tLS0tLS0tDQoNCg0KIyAjIHJlZHVjZWQgZm9ybTogDQojIHJlZHVjZWRfZm9ybV9zcGVuZGluZyA8LSBvbHModjJkbGVuY21wc190MSB+ICANCiMgICAgICAgICAgICAgICAgICAgICAgICAgICAgICAgIGNhYmluZXRJTkMgKiANCiMgICAgICAgICAgICAgICAgICAgICAgICAgICAgICAgIGxvZyh0b3RhbF9zdW1fZXhjZXB0IC8gR0RQKSArDQojICAgICAgICAgICAgICAgICAgICAgICAgICAgICAgICBsb2coZGdhX2dkcCArIDAuMDAxKSArIA0KIyAgICAgICAgICAgICAgICAgICAgICAgICAgICAgICAgbG9nKHByb2dyYW1fYWlkX2dkcCArICsgMC4wMDEpICsgDQojICAgICAgICAgICAgICAgICAgICAgICAgICAgICAgICBsb2coR0RQX3Blcl9jYXBpdGEpICsNCiMgICAgICAgICAgICAgICAgICAgICAgICAgICAgICAgIGxvZyhwb3B1bGF0aW9uKSArDQojICAgICAgICAgICAgICAgICAgICAgICAgICAgICAgICBjb25mX2ludGVucyArDQojICAgICAgICAgICAgICAgICAgICAgICAgICAgICAgICBub25zdGF0ZSArIA0KIyAgICAgICAgICAgICAgICAgICAgICAgICAgICAgICAgZmgsDQojICAgICAgICAgICAgICAgICAgICAgICAgICAgICAgZGF0YT1pdl9uYSwgeD1ULCB5PVQpDQojIHJlZHVjZWRfZm9ybV9zcGVuZGluZyA8LSByb2Jjb3YocmVkdWNlZF9mb3JtX3NwZW5kaW5nLCBpdl9uYSRHV05vKQ0KIyANCiMgDQojIHJlZHVjZWRfZm9ybV9jb3JyIDwtIG9scyh2MnhfY29ycl90MSB+ICANCiMgICAgICAgICAgICAgICAgICAgICAgICAgICAgICAgIGNhYmluZXRDT1VOVCAqIA0KIyAgICAgICAgICAgICAgICAgICAgICAgICAgICAgICAgbG9nKHRvdGFsX3N1bV9leGNlcHQgLyBHRFApICsNCiMgICAgICAgICAgICAgICAgICAgICAgICAgICAgICAgIGxvZyhHRFBfcGVyX2NhcGl0YSkgKw0KIyAgICAgICAgICAgICAgICAgICAgICAgICAgICAgICAgbG9nKHBvcHVsYXRpb24pICsNCiMgICAgICAgICAgICAgICAgICAgICAgICAgICAgICAgIGNvbmZfaW50ZW5zICsNCiMgICAgICAgICAgICAgICAgICAgICAgICAgICAgICAgIG5vbnN0YXRlICsgDQojICAgICAgICAgICAgICAgICAgICAgICAgICAgICAgICBmaCArDQojICAgICAgICAgICAgICAgICAgICAgICAgICAgICAgICBwb2xpdHkyLA0KIyAgICAgICAgICAgICAgICAgICAgICAgICAgICAgIGRhdGE9aXZfbmEsIHg9VCwgeT1UKQ0KIyByZWR1Y2VkX2Zvcm1fY29yciAgPC0gcm9iY292KHJlZHVjZWRfZm9ybV9jb3JyICwgaXZfbmEkR1dObykNCg0KDQoNCiMgMi4zIElWIEFuYWx5c2lzIC0tLS0tLS0tLS0tLS0tLS0tLS0tLS0tLS0tLS0tLS0tLS0tLS0tLS0tLS0tLS0tLS0tLS0tLS0tLS0tLS0NCg0KIyB0byBwcm9jZWVkIHdpdGggSVYgZXN0aW1hdGlvbiBJIGZpcnN0IGhhcmQtY29kZSB0aGUgaW5zdHJ1bWVudA0KaXZfbmEkaW5zdHJfYWlkX2dkcF9sbiA8LSBsb2coaXZfbmEkdG90YWxfc3VtX2V4Y2VwdCAvIGl2X25hJEdEUCkNCg0KIyBkYXRhIHRyYW5zZm9ybWF0aW9uIGZvciBTdGF0YQ0KaXZfbmEkbG5fZ2RwX3BjIDwtIGxvZyhpdl9uYSRHRFBfcGVyX2NhcGl0YSkNCml2X25hJGxuX3BvcCA8LSBsb2coaXZfbmEkcG9wdWxhdGlvbikNCiMgaXZfbmEkZGdhX2dkcF9sbiA8LSBsb2coaXZfbmEkZGdhX2dkcCArIDAuMDEpDQojIGl2X25hJHByb2dyYW1fYWlkX2dkcF9sbiA8LSBsb2coaXZfbmEkcHJvZ3JhbV9haWRfZ2RwICsgMC4wMSkNCg0KIyBhbmQgc2F2ZSBkYXRhIHRvIFN0YXRhIGZvcm1hdA0KZm9yZWlnbjo6d3JpdGUuZHRhKGl2X25hLCAiLi9kYXRhL2l2X25hX3NwZW5kaW5nLmR0YSIpDQoNCg0KIyBoYXJkIGNvZGUgaW50ZXJhY3Rpb24gdmFyaWFibGUNCml2X25hJGNhYmluY1hhaWQgPC0gaXZfbmEkYWlkZGF0YV9BaWRHRFBfbG4gKiBpdl9uYSRjYWJpbmV0SU5DDQppdl9uYSRjYWJpbmNYYWlkX2luc3RyIDwtIGl2X25hJGluc3RyX2FpZF9nZHBfbG4gKiBpdl9uYSRjYWJpbmV0SU5DDQoNCg0KbGlicmFyeShsZmUpDQppdl9zcGVuZGluZyA8LSBmZWxtKHYyZGxlbmNtcHNfdDEgfiANCiAgICAgICAgICAgICAgICAgICAgICBjYWJpbmV0SU5DICsgICMgb3V0Y29tZSBlcXVhdGlvbiAvIDJuZCBzdGFnZSByZWdyZXNzaW9uDQogICAgICAgICAgICAgICAgICAgICAgIA0KICAgICAgICAgICAgICAgICAgIA0KICAgICAgICAgICAgICAgICAgICAgIGxuX2dkcF9wYyArDQogICAgICAgICAgICAgICAgICAgICAgbG5fcG9wICsNCiAgICAgICAgICAgICAgICAgICAgICBjb25mX2ludGVucyArDQogICAgICAgICAgICAgICAgICAgICAgbm9uc3RhdGUgKw0KICAgICAgICAgICAgICAgICAgICAgICBXQm5hdHJlcyArDQogICAgICAgICAgICAgICAgICAgICAgIGZoIA0KICAgICAgICAgICAgICAgICAgICAgICB8IDAgfCAoYWlkZGF0YV9BaWRHRFBfbG58Y2FiaW5jWGFpZCB+IA0KICAgICAgICAgICAgICAgICAgICAgICAgICAgICAgICBpbnN0cl9haWRfZ2RwX2xuICsgY2FiaW5jWGFpZF9pbnN0cikgfCBHV05vLCANCiAgICAgICAgICAgICAgICAgICAgICAgZGF0YSA9IGl2X25hKQ0KDQojIE91dHB1dA0KbW9kZWxfbGlzdCA8LSBsaXN0KG1vZGVsX3NwZW5kX21hdGNoZWQsIA0KICAgICAgICAgICAgICAgICAgIGl2X3NwZW5kaW5nKQ0KDQoNCiMjIE9yZGVyIG9mIGNvZWZmaWNpZW50cyBpbiBvdXRwdXQgdGFibGUNCm5hbWVfbWFwX3JvYnVzdG5lc3MgPC0gbGlzdChjYWJpbmV0SU5DID0gIlBvd2VyLVNoYXJpbmcgKGJpbmFyeSkiLA0KICAgICAgICAgICAgICAgICAiY2FiaW5ldElOQyAqIGFpZGRhdGFfQWlkR0RQX2xuIiA9ICJQb3dlci1TaGFyaW5nIChiaW5hcnkpICogQWlkIiwNCiAgICAgICAgICAgICAgICAgDQogICAgICAgICAgICAgICAgICJgY2FiaW5jWGFpZChmaXQpYCIgPSAiUG93ZXItU2hhcmluZyAoYmluYXJ5KSAqIEFpZCIsIA0KICAgICAgICAgICAgICAgICAiYGFpZGRhdGFfQWlkR0RQX2xuKGZpdClgIiA9ICJBaWQgLyBHRFAgKGxvZykiLA0KICAgICAgICAgICAgICAgICAiYWlkZGF0YV9BaWRHRFBfbG4iID0gIkFpZCAvIEdEUCAobG9nKSIsDQogICAgICAgICAgICAgICAgIA0KICAgICAgICAgICAgICAgICAibG5fZ2RwX3BjIiA9ICJHRFAgcC9jIiwNCiAgICAgICAgICAgICAgICAgImxuX3BvcCIgPSAiUG9wdWxhdGlvbiIsDQogICAgICAgICAgICAgICAgIGNvbmZfaW50ZW5zID0gIkNvbmZsaWN0IEludGVuc2l0eSIsDQogICAgICAgICAgICAgICAgIG5vbnN0YXRlID0gIk5vbi1TdGF0ZSBWaW9sZW5jZSIsDQogICAgICAgICAgICAgICAgIFdCbmF0cmVzID0gIk5hdC4gUmVzLiBSZW50cyIsDQogICAgICAgICAgICAgICAgIHBvbGl0eTIgPSAiUmVnaW1lIFR5cGUiLA0KICAgICAgICAgICAgICAgICBmaCA9ICJSZWdpbWUgVHlwZSIpDQoNCnNvdXJjZSgiLi9mdW5jdGlvbnMvY3VzdG9tX3RleHJlZy5SIikNCmVudmlyb25tZW50KGN1c3RvbV90ZXhyZWcpIDwtIGFzTmFtZXNwYWNlKCd0ZXhyZWcnKQ0KDQpzb3VyY2UoIi4vZnVuY3Rpb25zL2N1c3RvbV90ZXhyZWcuUiIpDQplbnZpcm9ubWVudChjdXN0b21fdGV4cmVnKSA8LSBhc05hbWVzcGFjZSgndGV4cmVnJykNCnNvdXJjZSgiZnVuY3Rpb25zL2V4dHJhY3RfZmVsbV9jdXN0b20uUiIpDQoNCg0KIyAjIE91dHB1dCBNYW51c2NyaXB0DQojIGN1c3RvbV90ZXhyZWcobCA9IG1vZGVsX2xpc3QsDQojICAgICAgICAgc3RhcnMgPSBjKDAuMDAxLCAwLjAxLCAwLjA1LCAwLjEpLA0KIyAgICAgICAgIHN5bWJvbCA9ICIrIiwNCiMgICAgICAgICB0YWJsZSA9IEYsDQojICAgICAgICAgYm9va3RhYnMgPSBULA0KIyAgICAgICAgIHVzZS5wYWNrYWdlcyA9IEYsDQojICAgICAgICAgZGNvbHVtbiA9IFQsDQojICAgICAgICAgY3VzdG9tLmNvZWYubWFwID0gbmFtZV9tYXBfcm9idXN0bmVzcywNCiMgICAgICAgICBmaWxlID0gIi4uL291dHB1dC9haWRwc19zcGVuZGluZ19lbmRvZ2VuZWl0eS50ZXgiLA0KIyAgICAgICAgIGN1c3RvbS5tb2RlbC5uYW1lcyA9IGMoIigxKSBNYXRjaGluZyIsDQojICAgICAgICAgICAgICAgICAgICAgICAgICAgICAgICAiKDIpIDJTTFMiKSwNCiMgICAgICAgIA0KIyAgICAgICAgIHN0YXIuc3ltYm9sID0gIlxcKiIsDQojICAgICAgICAgaW5jbHVkZS5sciA9IEYsIA0KIyAgICAgICAgIGluY2x1ZGUuY2x1c3RlciA9IEYsIA0KIyAgICAgICAgICBhZGQubGluZXMgPSBsaXN0KGMoIkNvdW50cmllcyIsIA0KIyAgICAgICAgICAgICAgICAgICAgICAgICAgICAgICAgICBsZW5ndGgodW5pcXVlKG1hdGNoX3NwZW5kX2RmJEdXTm8pKSwgDQojICAgICAgICAgICAgICAgICAgICAgICAgICAgICAgICAgIGxlbmd0aCh1bmlxdWUoZGlzc19kZiRHV05vKSkpLCANCiMgICAgICAgICAgICAgICAgICAgICAgICAgICAgICAgIGMoIktsZWliZXJnZW4tUGFhcCByayBXYWxkIEYgc3RhdGlzdGljIiwNCiMgICAgICAgICAgICAgICAgICAgICAgICAgICAgICAgICAgIiIsIA0KIyAgICAgICAgICAgICAgICAgICAgICAgICAgICAgICAgICAiNDMuMTEiKSksDQojICAgICAgICAgaW5jbHVkZS5yc3F1YXJlZCA9IEYsIA0KIyAgICAgICAgIGluY2x1ZGUudmFyaWFuY2UgPSBGKQ0KDQoNCmBgYA0KDQoNCg0KIyBTdXBwbGVtZW50OiBTdGF0YSBjb2RlIHRvIGdlbmVyYXRlIEYtU3RhdGlzdGljcyBmb3IgSVYvMlNMUyBtb2RlbHMNCmBgYHtyLCBlbmdpbmUgPSAic3RhdGEiLCBldmFsID0gRn0NCg0KdXNlICIuL2RhdGEvaXZfbmFfc3BlbmRpbmcuZHRhIiwgY2xlYXINCg0KKiBHZW5lcmF0ZSBpbnRlcmFjdGlvbnMgJiBpbnRlcmFjdGlvbnMgd2l0aCBpbnN0cnVtZW50DQpnZW4gY2FiWGFpZCA9IGNhYmluZXRJTkMgKiBhaWRkYXRhX0FpZEdEUF9sbg0KZ2VuIGNhYlhhaWRfaW5zdHIgPSBjYWJpbmV0SU5DICogaW5zdHJfYWlkX2dkcF9sbg0KDQoNCml2cmVnMiB2MmRsZW5jbXBzX3QxIGNhYmluZXRJTkMgbG5fZ2RwX3BjIGxuX3BvcCBub25zdGF0ZSBjb25mX2ludGVucyBXQm5hdHJlcyBmaCAvLy8NCihhaWRkYXRhX0FpZEdEUF9sbiBjYWJYYWlkID0gaW5zdHJfYWlkX2dkcF9sbiBjYWJYYWlkX2luc3RyKSwgY2x1c3RlcihHV05vKSBmaXJzdCANCg0KDQpgYGA=